> ## Documentation Index
> Fetch the complete documentation index at: https://help.voxdash.com/llms.txt
> Use this file to discover all available pages before exploring further.
# Data Panel Dashboard
The **Data Panel Dashboard** is your primary command center in VoxDash. It provides a high-level, visual overview of your entire analytics environment, transforming complex datasets into actionable insights through intuitive graphs, charts, and tables.
## Understanding Dashboard
The VoxDash Data Panel is organized into modular widgets. Each widget offers a snapshot of a specific aspect of your account. You can navigate through these sections to monitor performance, manage resources, and track activity.
 ### Storage Usage
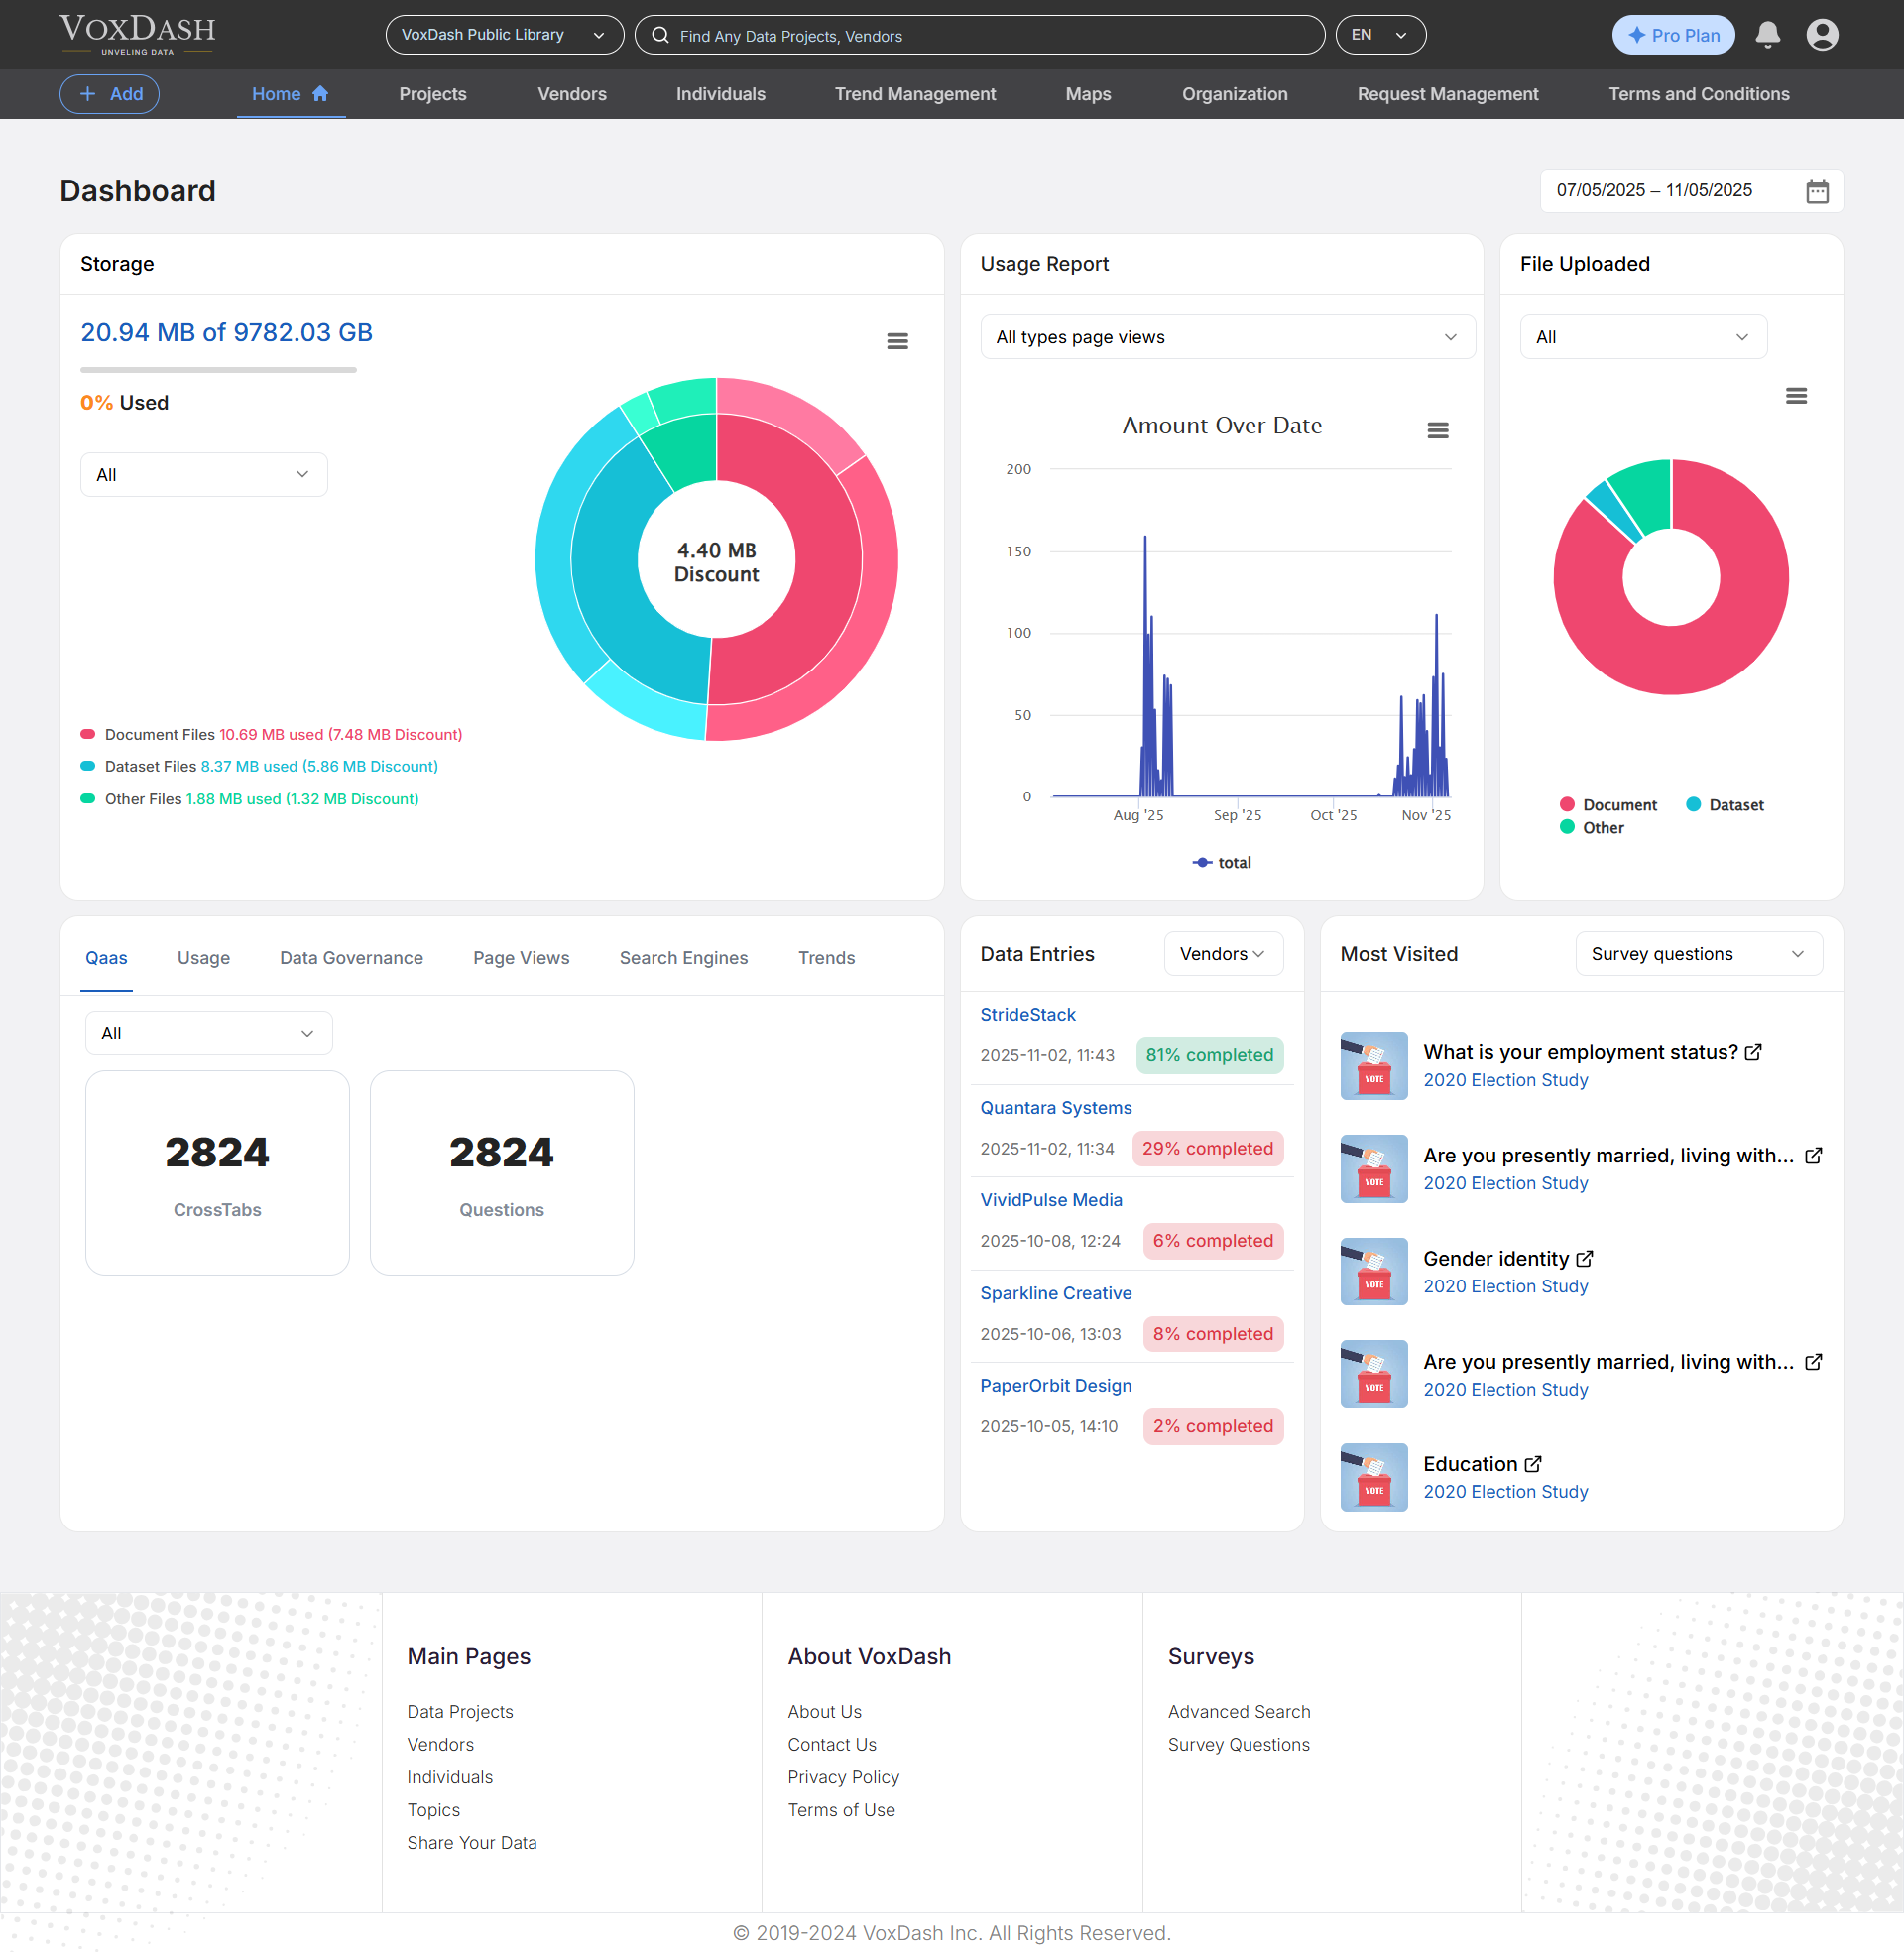
This widget keeps you informed about your account's resource consumption.
* **What it shows:** The total amount of storage space utilized by your uploaded files.
### Storage Usage
This widget keeps you informed about your account's resource consumption.
* **What it shows:** The total amount of storage space utilized by your uploaded files.
 ### Usage Reports
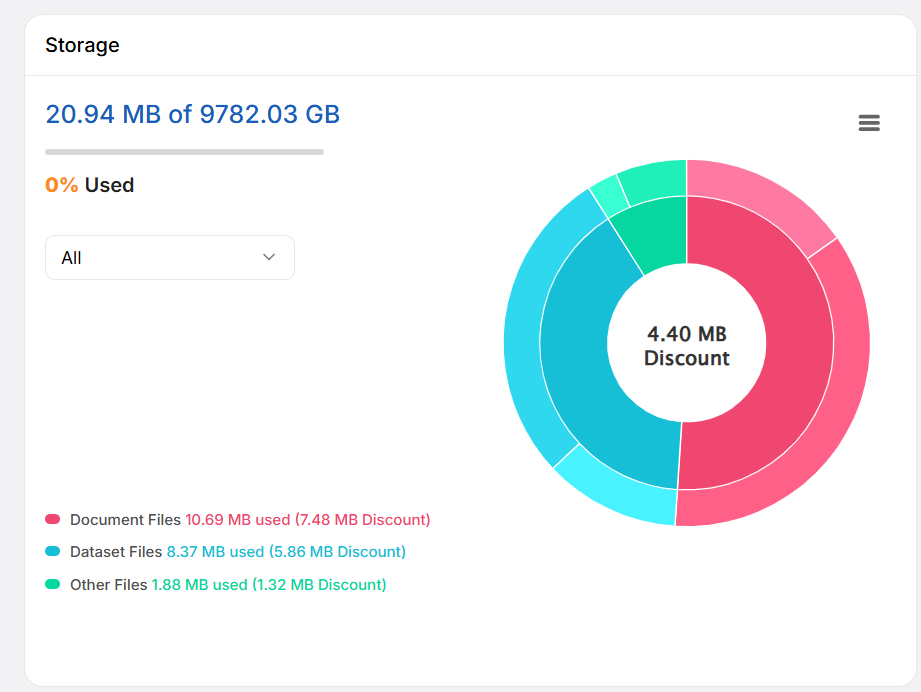
The Usage Report widget provides a visual summary of page traffic across the VoxDash platform.
* **How to use it:** Use the dropdown menu at the top of the chart to select specific pages you wish to monitor.
* **Deeper Insights:** The dashboard shows a quick summary, but if you need a granular analysis of traffic patterns or peak activity times, click the **Report** tab to navigate directly to the dedicated **Reports Page**.
### Usage Reports
The Usage Report widget provides a visual summary of page traffic across the VoxDash platform.
* **How to use it:** Use the dropdown menu at the top of the chart to select specific pages you wish to monitor.
* **Deeper Insights:** The dashboard shows a quick summary, but if you need a granular analysis of traffic patterns or peak activity times, click the **Report** tab to navigate directly to the dedicated **Reports Page**.
 ### Files Uploaded
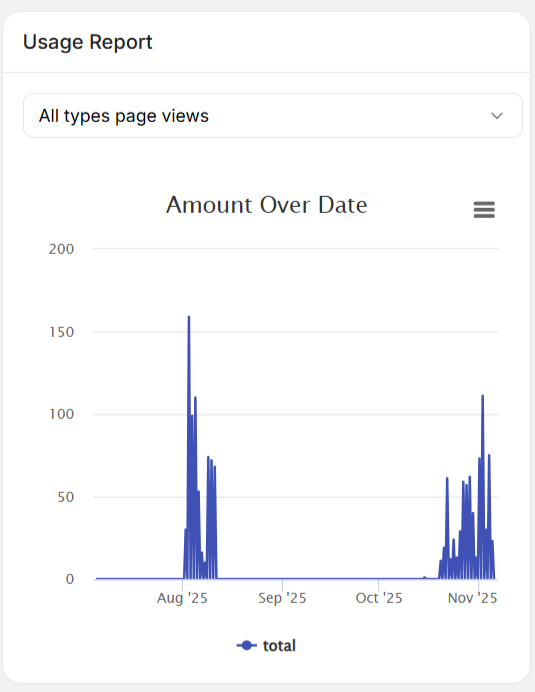
This section displays a breakdown of your uploaded data.
* **What it shows:** A percentage-based visual of your file inventory.
* **Filtering:** You can filter the chart to view the distribution of **All Files**, **Private**, **Semi-Private**, or **Public** files. This is particularly useful for data governance, helping you ensure that sensitive data is correctly categorized.
### Files Uploaded
This section displays a breakdown of your uploaded data.
* **What it shows:** A percentage-based visual of your file inventory.
* **Filtering:** You can filter the chart to view the distribution of **All Files**, **Private**, **Semi-Private**, or **Public** files. This is particularly useful for data governance, helping you ensure that sensitive data is correctly categorized.
 ## 2. Quick Access & Engagement Metrics
### Data Entries
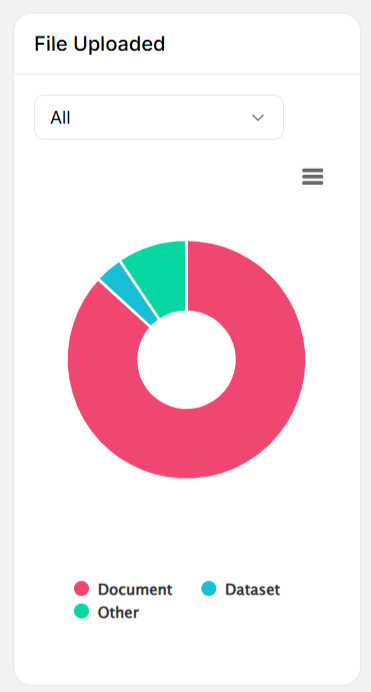
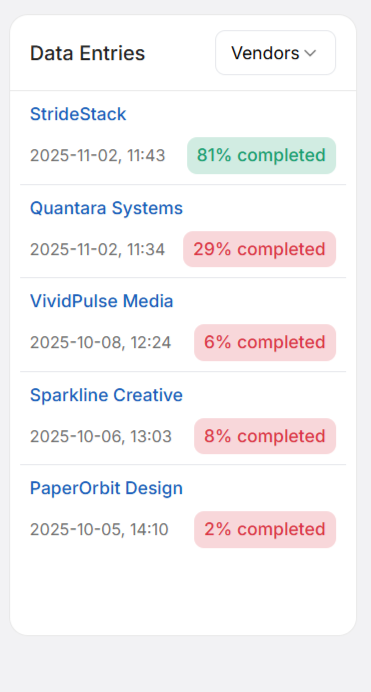
This widget serves as your "Recent Activity" feed, providing immediate access to the items you work with most frequently:
* **Data Projects:** Your active analytic environments.
* **Vendors:** Third-party data sources or providers linked to your account.
* **Individuals:** Specific profiles or stakeholders you are currently tracking.
## 2. Quick Access & Engagement Metrics
### Data Entries
This widget serves as your "Recent Activity" feed, providing immediate access to the items you work with most frequently:
* **Data Projects:** Your active analytic environments.
* **Vendors:** Third-party data sources or providers linked to your account.
* **Individuals:** Specific profiles or stakeholders you are currently tracking.
 ### Most Visited
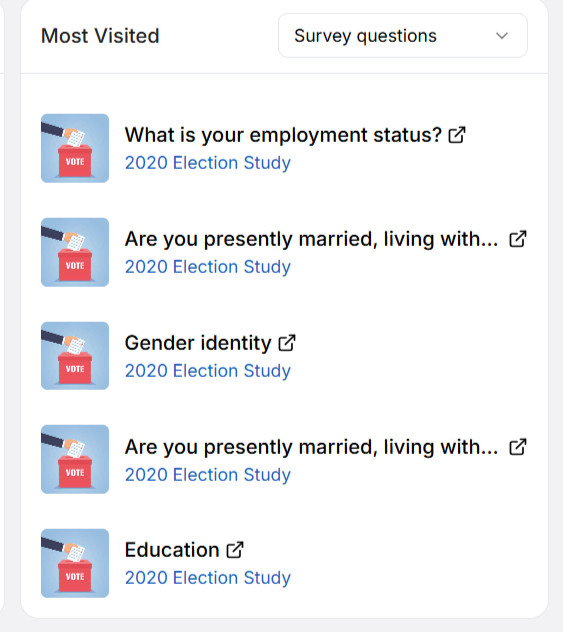
Stay in the loop with what matters most. This section highlights your most frequently accessed assets:
* **Survey Questions:** Identify which questions generate the most interest.
* **Vendors & Individuals:** See which entities your team is interacting with the most.
* **Datasets:** Quickly jump back into the datasets that are central to your current analysis.
### Most Visited
Stay in the loop with what matters most. This section highlights your most frequently accessed assets:
* **Survey Questions:** Identify which questions generate the most interest.
* **Vendors & Individuals:** See which entities your team is interacting with the most.
* **Datasets:** Quickly jump back into the datasets that are central to your current analysis.
 ## 3. Total View Counts (Reporting Overview)
VoxDash categorizes data provider metrics into distinct domains to ensure you have the right context for every report. On the dashboard, you will see the **total aggregate numbers** for each of these sub-categories.
**Primary Report Categories:**
* **Page Views:** Tracking how often your dashboards or reports are opened.
* **QaaS (Questions as a Service):** Usage metrics for your survey questions.
* **Search Engines:** Visibility and performance of your data within search tools.
* **Usage:** General platform engagement metrics.
* **Data Governance:** Compliance and access metrics for your files.
* **Trend:** Insights into the movement and patterns of your data over time.
## 3. Total View Counts (Reporting Overview)
VoxDash categorizes data provider metrics into distinct domains to ensure you have the right context for every report. On the dashboard, you will see the **total aggregate numbers** for each of these sub-categories.
**Primary Report Categories:**
* **Page Views:** Tracking how often your dashboards or reports are opened.
* **QaaS (Questions as a Service):** Usage metrics for your survey questions.
* **Search Engines:** Visibility and performance of your data within search tools.
* **Usage:** General platform engagement metrics.
* **Data Governance:** Compliance and access metrics for your files.
* **Trend:** Insights into the movement and patterns of your data over time.
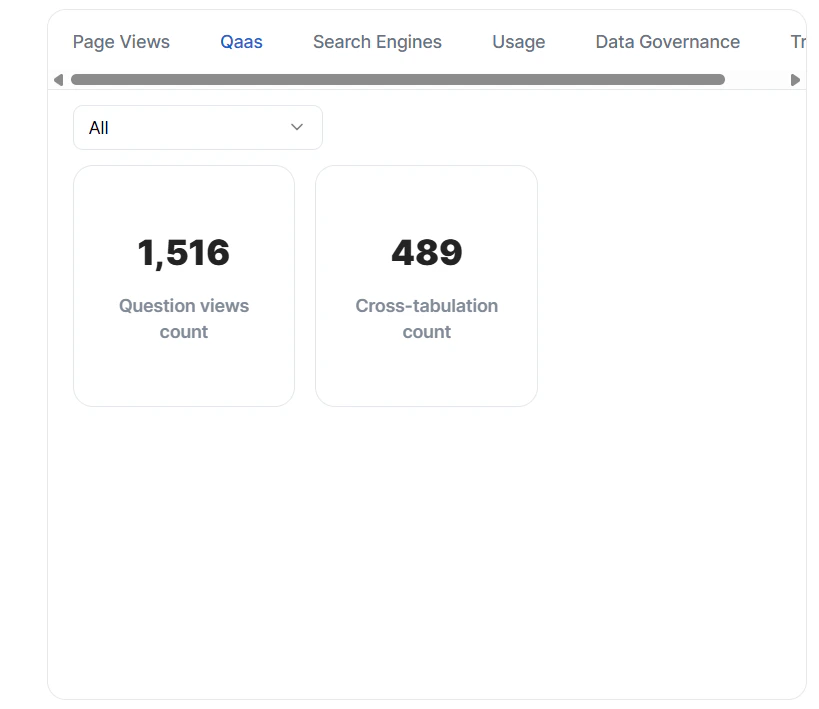 > **Note:** The dashboard provides a high-level "Total Count" for these metrics. To perform deep-dive analysis, investigate trends, or export raw data, please navigate to the full **Reports Page**.
### Tips for Success
* **Customize your view:** Regularly use the filters at the top of your charts to toggle between project types.
* **Monitor Trends:** Use the "Total View Counts" as a pulse check; if you notice a sudden spike or drop in a category, head over to the **Reports Page** to investigate the underlying cause.
* **Collaborate:** Use the dashboard as a baseline for team meetings. It provides a shared "source of truth" that helps align your team on current project status and data priorities.
> **Note:** The dashboard provides a high-level "Total Count" for these metrics. To perform deep-dive analysis, investigate trends, or export raw data, please navigate to the full **Reports Page**.
### Tips for Success
* **Customize your view:** Regularly use the filters at the top of your charts to toggle between project types.
* **Monitor Trends:** Use the "Total View Counts" as a pulse check; if you notice a sudden spike or drop in a category, head over to the **Reports Page** to investigate the underlying cause.
* **Collaborate:** Use the dashboard as a baseline for team meetings. It provides a shared "source of truth" that helps align your team on current project status and data priorities.