> ## Documentation Index
> Fetch the complete documentation index at: https://help.voxdash.com/llms.txt
> Use this file to discover all available pages before exploring further.
# Setting Up Maps for Survey Variables
In VoxDash, you can use geographical maps to visualize and analyze survey data by location.
## 1. Adding Map Variables During Survey Data Entry
You can incorporate location-based (“Map”) variables directly when configuring your survey data entry in VoxDash.
### Step 1: Open Survey Data Entry
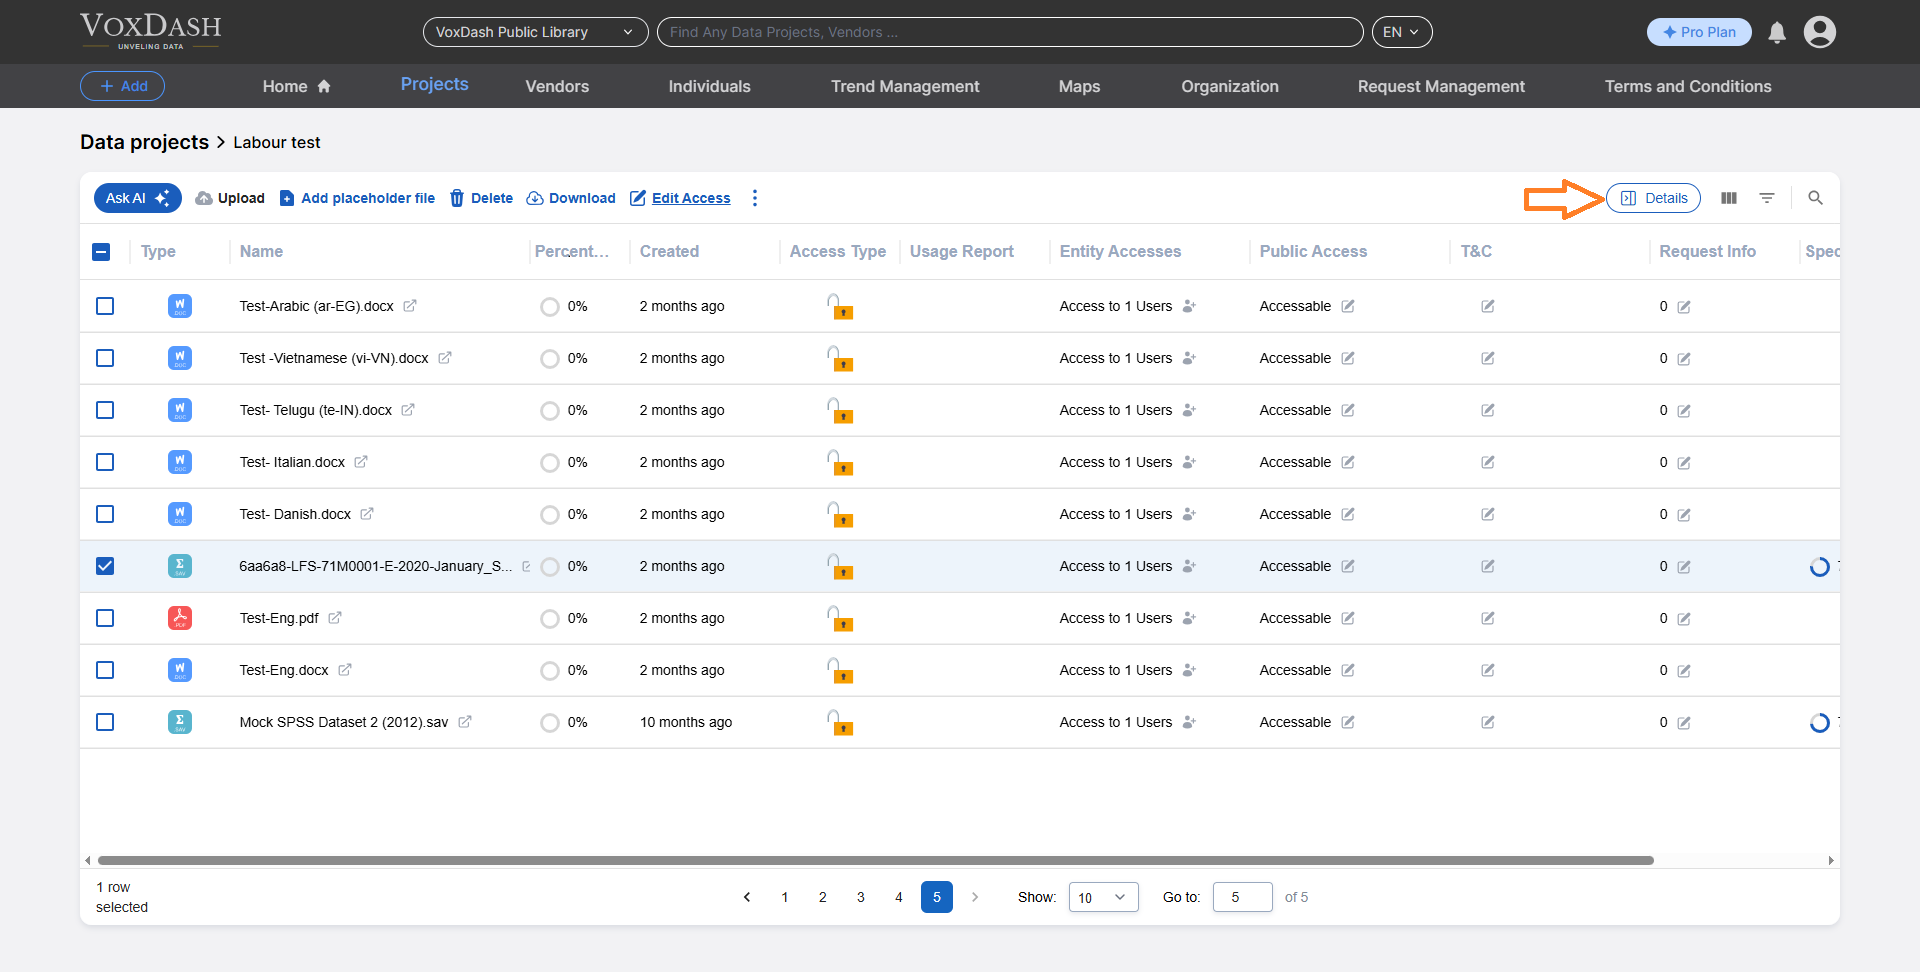
1. Go to the **Data Provider Panel**.
2. Open the **File Management Table**.
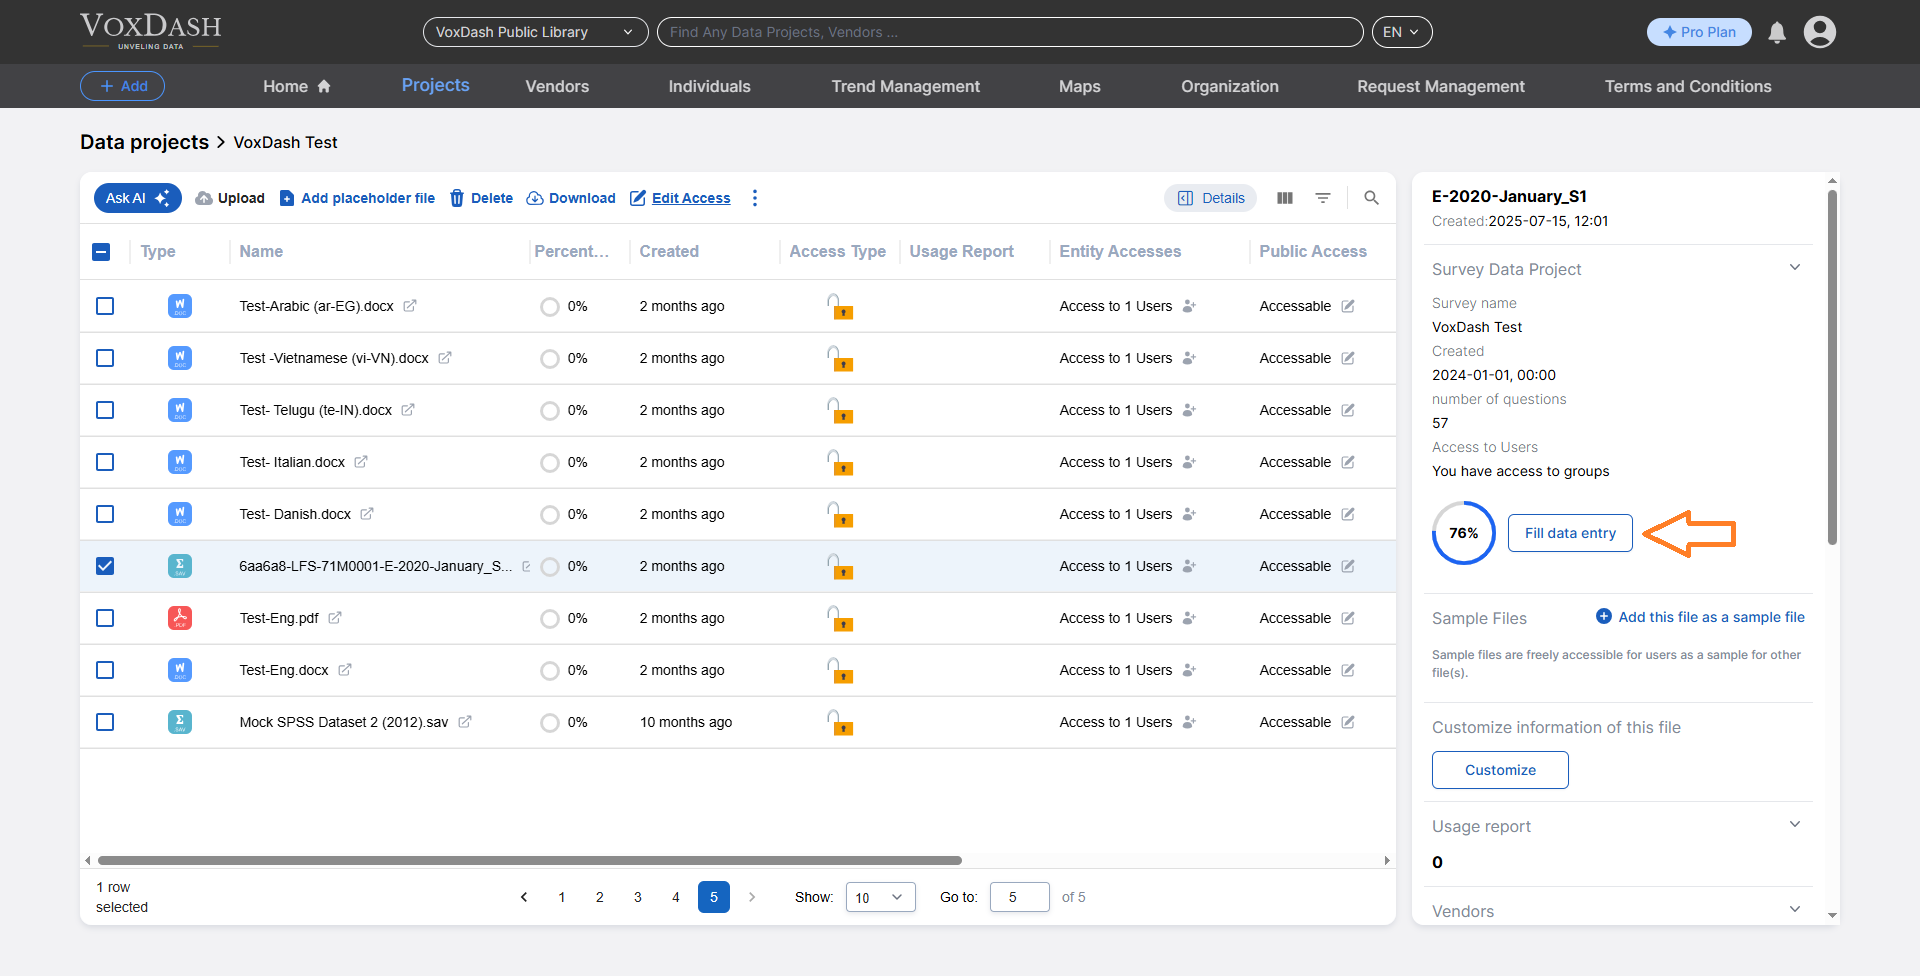
3. Find the dataset that contains your survey data and select it to **edit the survey data entry**.
 ### Step 2: Go to the Variable Setup step
1. Proceed to **Step 3** of the survey data entry process.
2. This step is where you define your survey’s **map variables**.
### Step 3: Add the “Map” variable
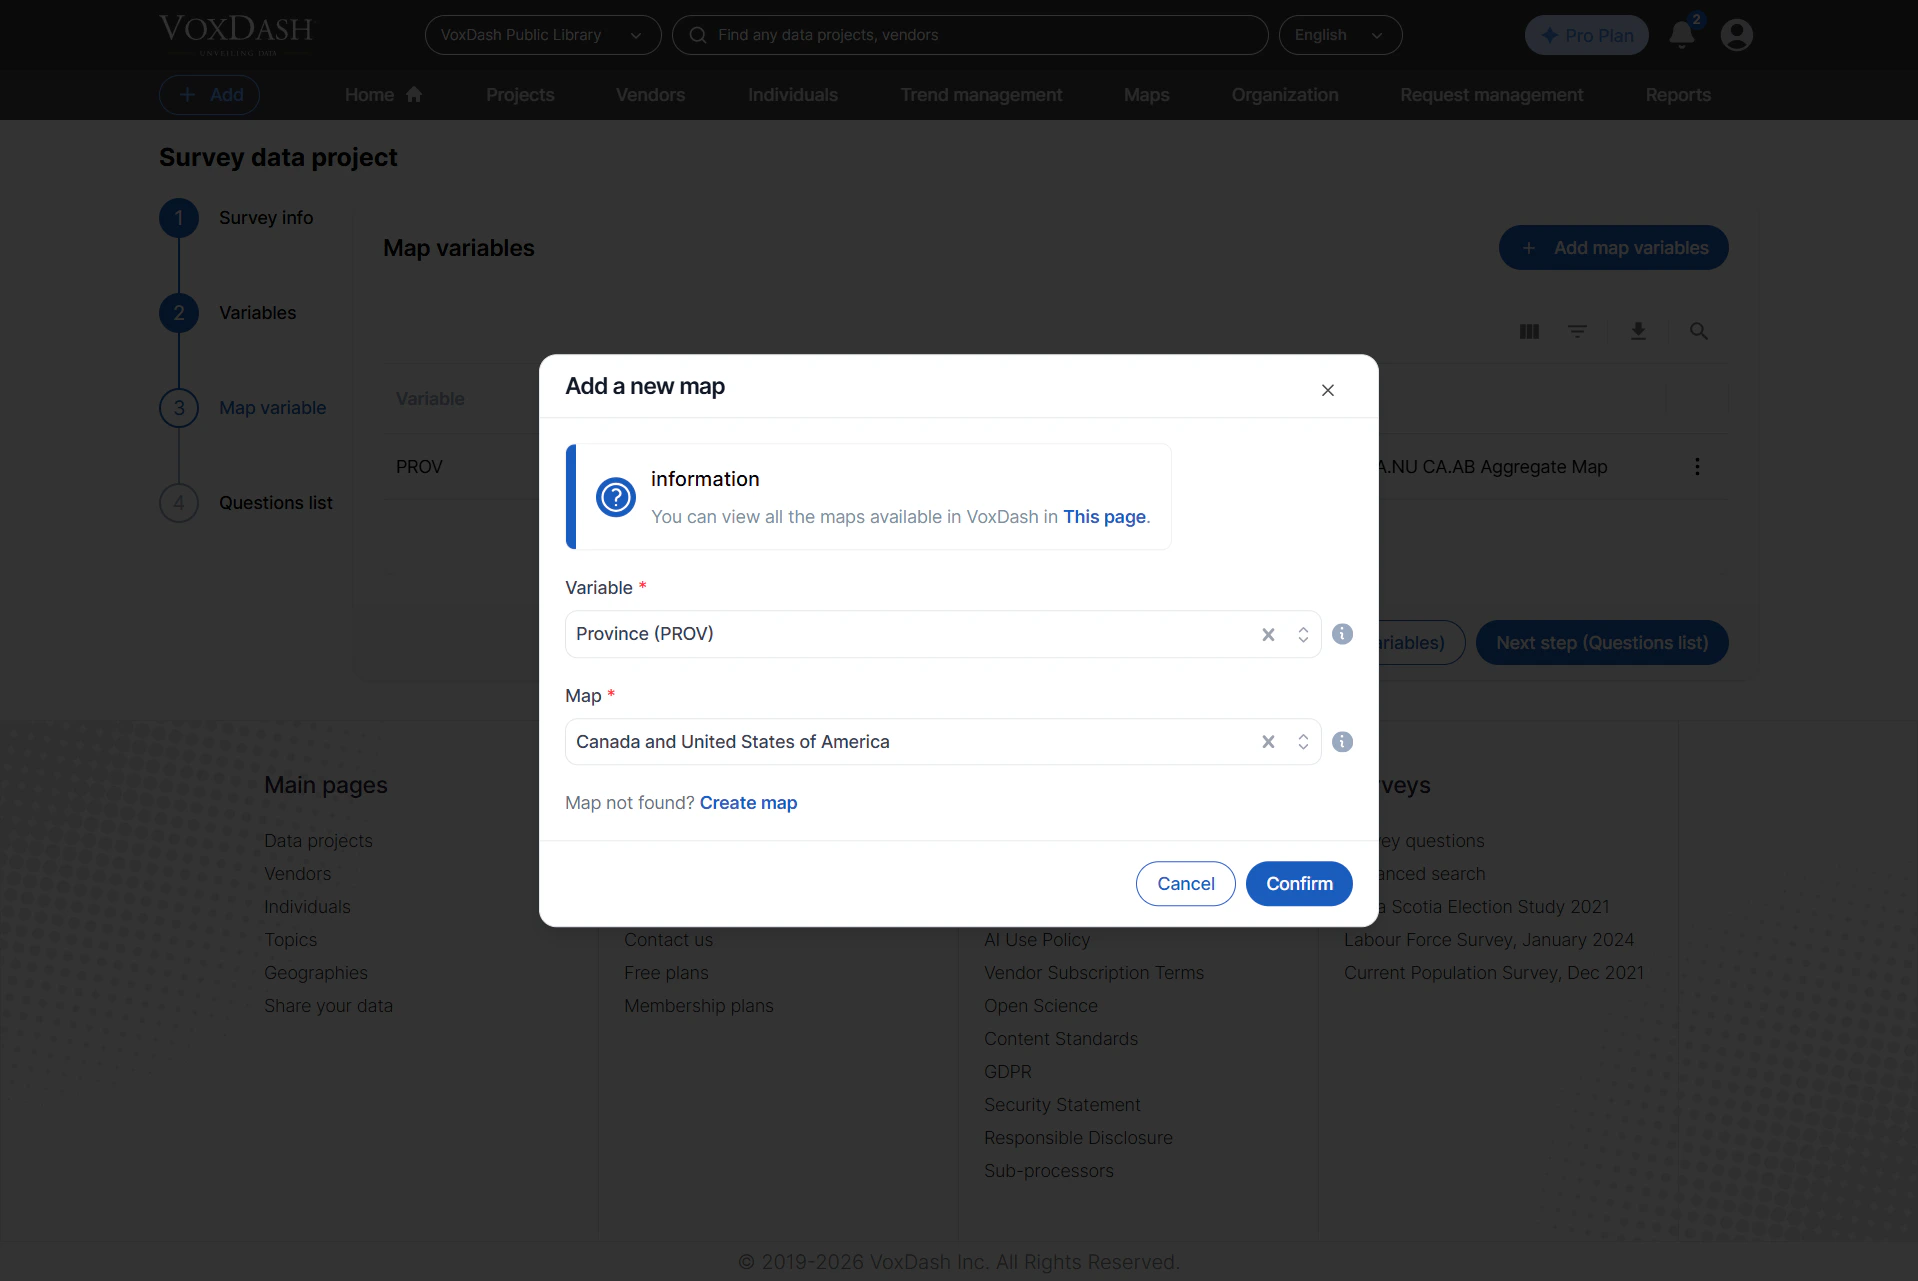
1. Choose **Add Variable** (or the relevant option in Step 3).
2. Based on your survey collection method, look for a variable related to geography, such as:
* **Country**
* **Region**
* **Province**
* (or other location levels used by your survey)
### Step 2: Go to the Variable Setup step
1. Proceed to **Step 3** of the survey data entry process.
2. This step is where you define your survey’s **map variables**.
### Step 3: Add the “Map” variable
1. Choose **Add Variable** (or the relevant option in Step 3).
2. Based on your survey collection method, look for a variable related to geography, such as:
* **Country**
* **Region**
* **Province**
* (or other location levels used by your survey)
 ## 2. How to Choose the Right Map for Your Survey
VoxDash offers multiple map types to match different geography levels and formats.
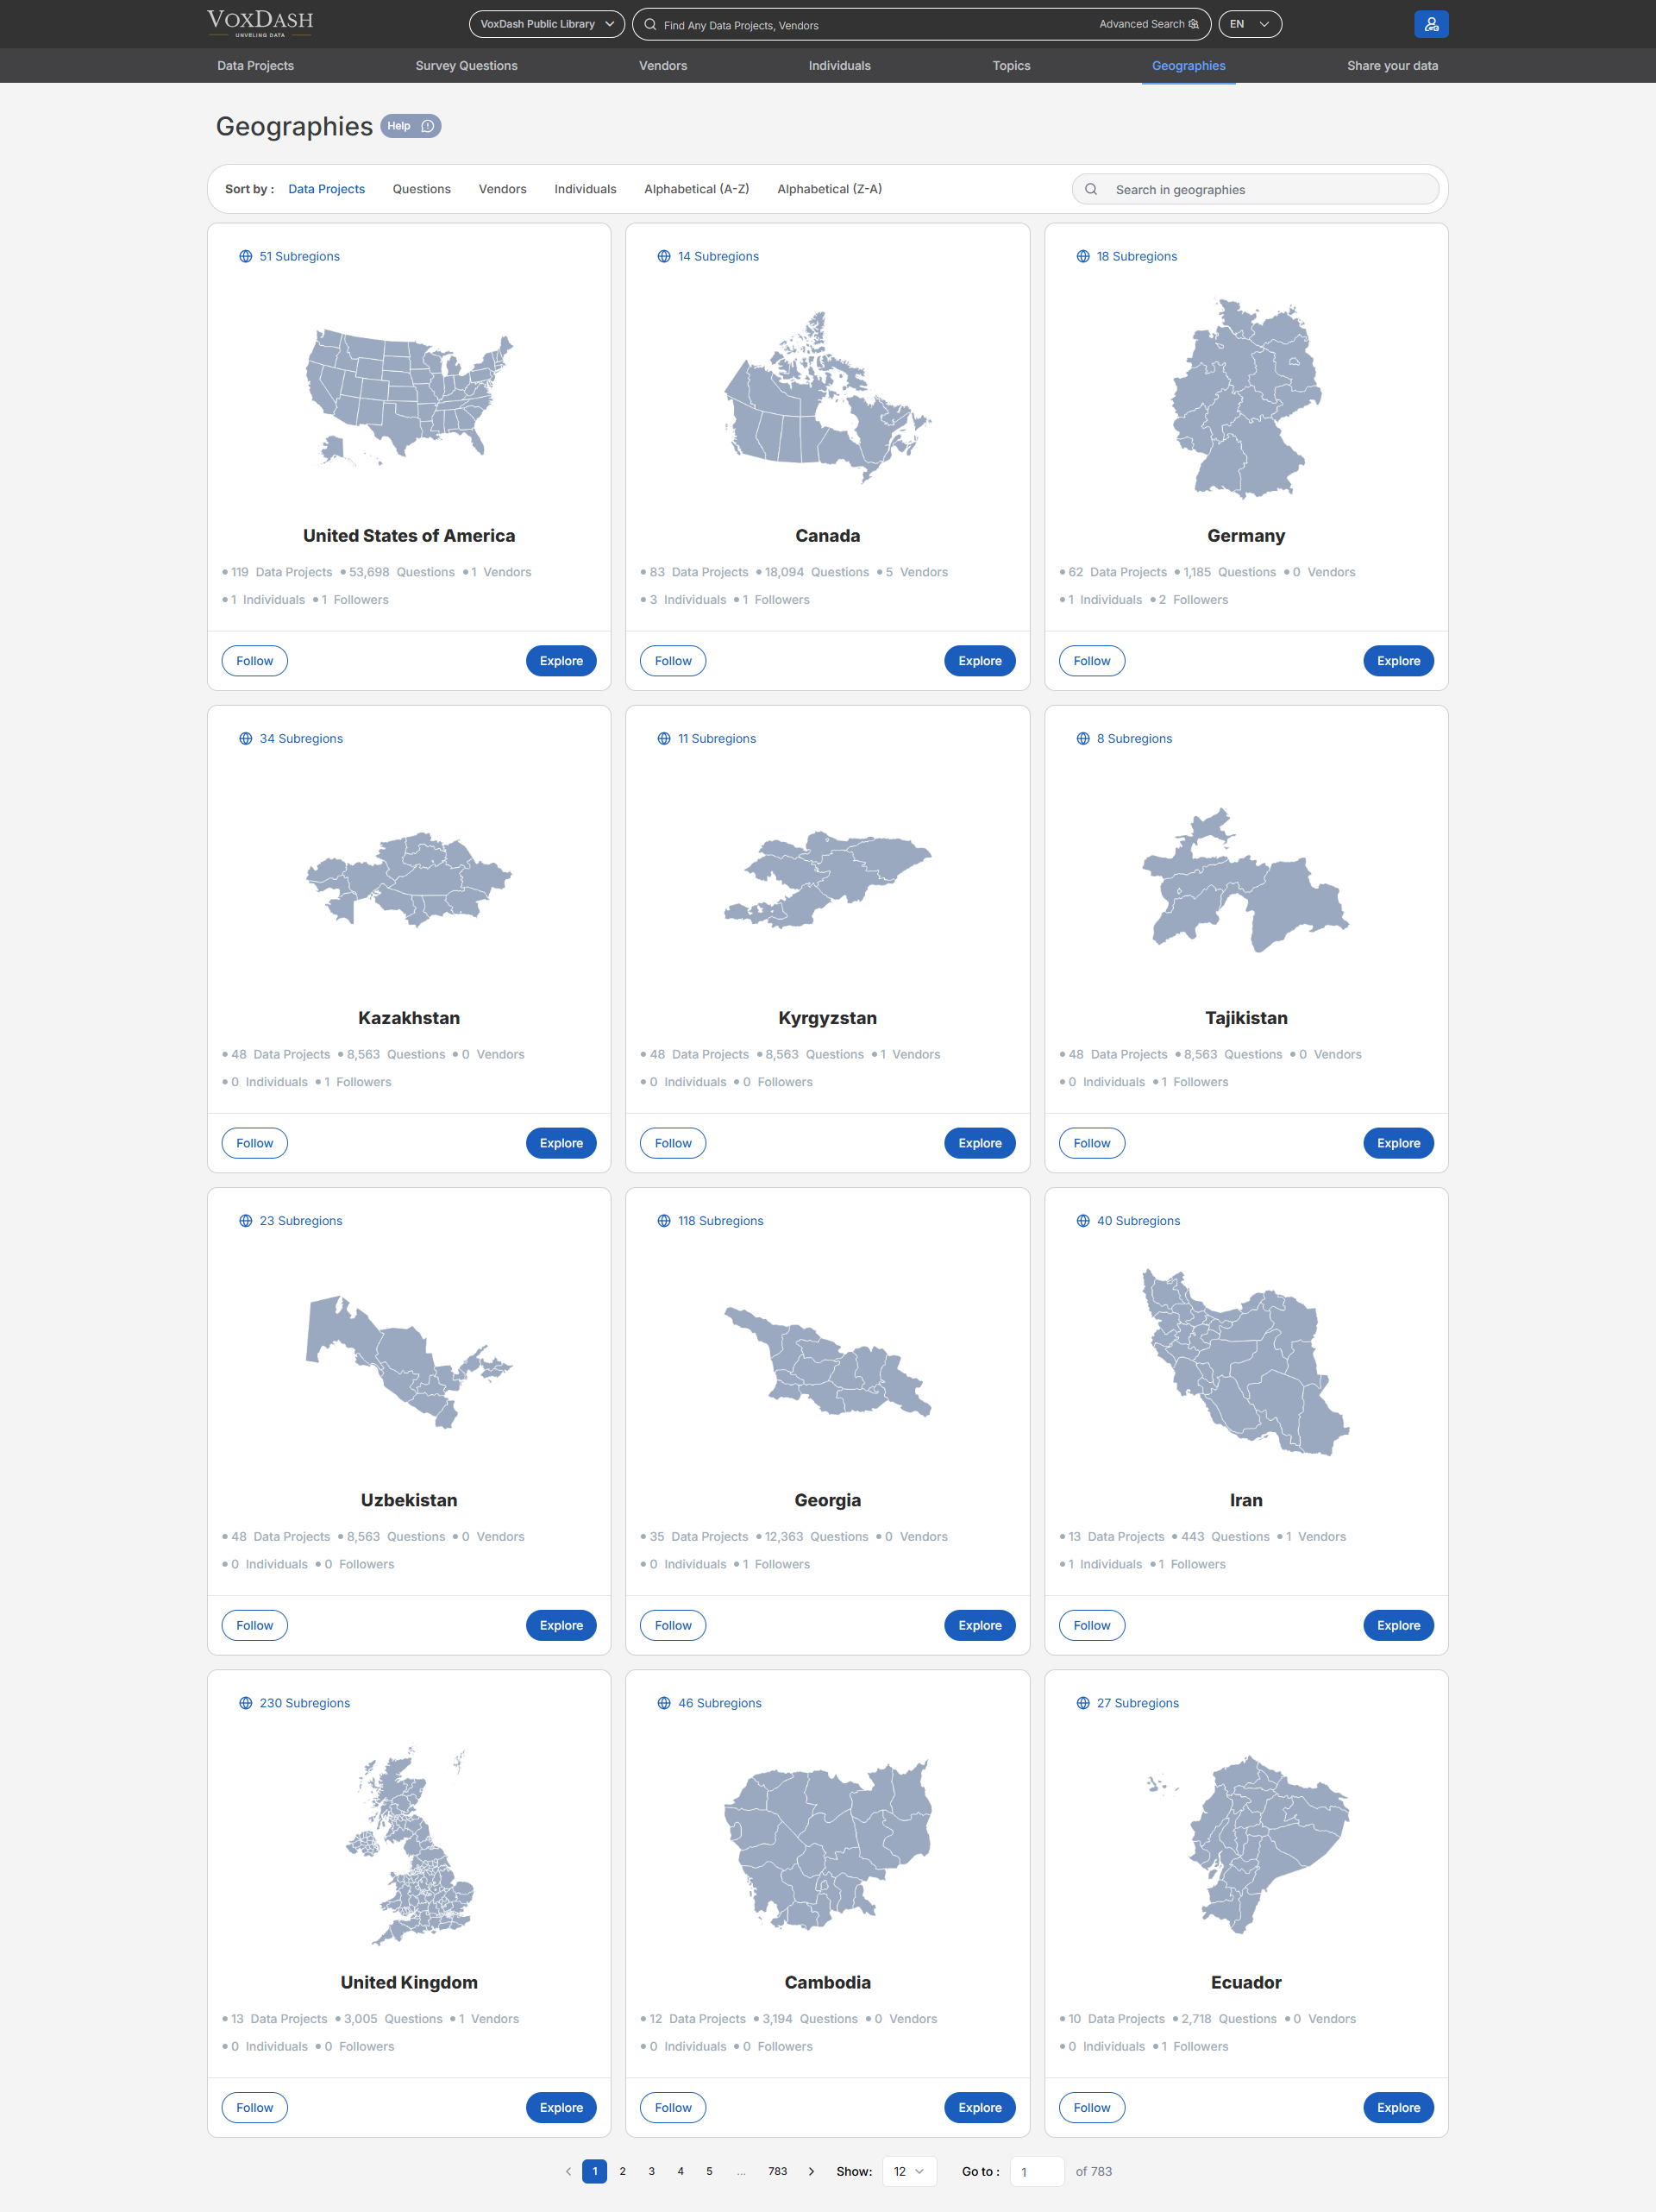
1. Navigate to the **Geo** page in VoxDash.
2. Browse the available maps and open the one that best matches your survey variable (for example, a “Province” map if your survey records provinces).
3. Once you find the correct map, you have two options:
* **Download the map regions Excel file** and compare it with your survey variables/responses.
* **Create a new map** if none of the existing maps match your needs.
For more details about available maps and how they work, read [Map Overview](/docs/Maps-&-Visualizations/Map-Overview).
## 2. How to Choose the Right Map for Your Survey
VoxDash offers multiple map types to match different geography levels and formats.
1. Navigate to the **Geo** page in VoxDash.
2. Browse the available maps and open the one that best matches your survey variable (for example, a “Province” map if your survey records provinces).
3. Once you find the correct map, you have two options:
* **Download the map regions Excel file** and compare it with your survey variables/responses.
* **Create a new map** if none of the existing maps match your needs.
For more details about available maps and how they work, read [Map Overview](/docs/Maps-&-Visualizations/Map-Overview).
 ## 3. Matching Regions and Handling Special Responses
After selecting the map, you must ensure that your survey region values correctly match the map’s region names.
### Match region names (abbreviations vs. full names)
* If your survey uses **abbreviations** (e.g., short forms), compare them with the **full region names** used inside VoxDash.
* Perform the match so VoxDash can correctly associate each response with the correct region.
### Re-match mismatched regions manually
* If any regions do not match automatically, you must **manually remap** them inside VoxDash.
* This ensures your analysis and visualizations do not place responses in the wrong locations.
### Handle “Don’t Know / Don’t Say” answers
If your dataset includes options like:
* **“Don’t Know”**
* **“Don’t Say”**
## 3. Matching Regions and Handling Special Responses
After selecting the map, you must ensure that your survey region values correctly match the map’s region names.
### Match region names (abbreviations vs. full names)
* If your survey uses **abbreviations** (e.g., short forms), compare them with the **full region names** used inside VoxDash.
* Perform the match so VoxDash can correctly associate each response with the correct region.
### Re-match mismatched regions manually
* If any regions do not match automatically, you must **manually remap** them inside VoxDash.
* This ensures your analysis and visualizations do not place responses in the wrong locations.
### Handle “Don’t Know / Don’t Say” answers
If your dataset includes options like:
* **“Don’t Know”**
* **“Don’t Say”**
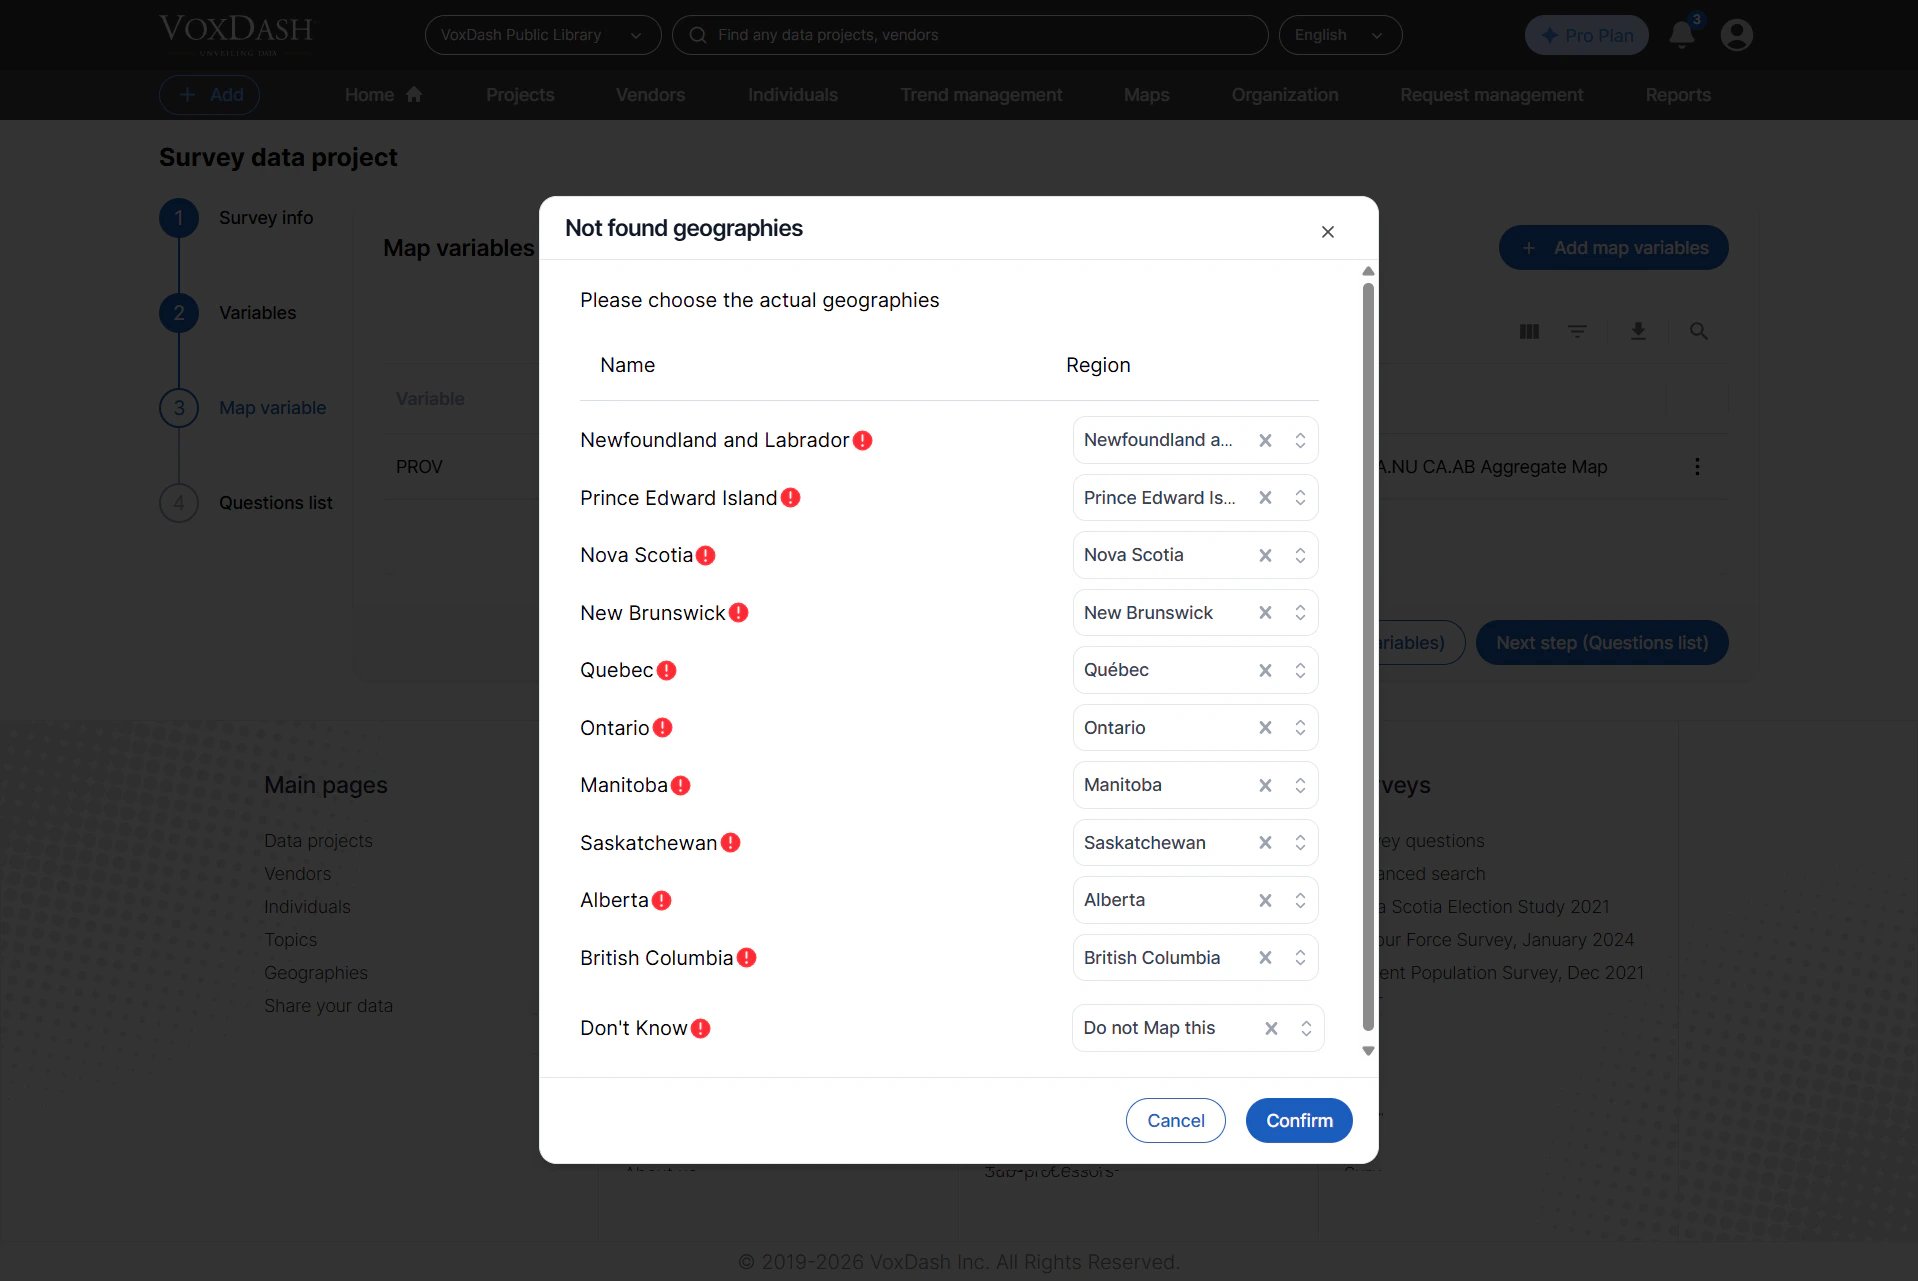 Then in VoxDash, select **“Don’t Map”** for those options so they are excluded from geographic mapping.
## 4. Upload the Map
When everything is matched and configured:
1. Click **Confirm**.
2. VoxDash uploads the map and applies it to your survey variable mapping.
## **Customization**
Customized maps allow you to create aggregated regions, combining multiple states or territories into new, meaningful geographic groupings. This is especially useful for organizations or studies that analyze data across custom territories, sales regions, or combined areas (e.g., “East Coast” or “Western Provinces”).
In customization you can:
1\. Create a new aggregated map based on your needs.
2\. View previously aggregated maps provided by VoxDash’s admins.
### **Creating a New Customized Map**
You can create a custom map by grouping multiple regions from the base map into new aggregated regions. This is useful when you want to analyze combined areas or custom territories.
Follow these steps to create a custom map:
1. **Create Custome Map**: Click on the Create Custome Map to start the process.
Then in VoxDash, select **“Don’t Map”** for those options so they are excluded from geographic mapping.
## 4. Upload the Map
When everything is matched and configured:
1. Click **Confirm**.
2. VoxDash uploads the map and applies it to your survey variable mapping.
## **Customization**
Customized maps allow you to create aggregated regions, combining multiple states or territories into new, meaningful geographic groupings. This is especially useful for organizations or studies that analyze data across custom territories, sales regions, or combined areas (e.g., “East Coast” or “Western Provinces”).
In customization you can:
1\. Create a new aggregated map based on your needs.
2\. View previously aggregated maps provided by VoxDash’s admins.
### **Creating a New Customized Map**
You can create a custom map by grouping multiple regions from the base map into new aggregated regions. This is useful when you want to analyze combined areas or custom territories.
Follow these steps to create a custom map:
1. **Create Custome Map**: Click on the Create Custome Map to start the process.

 2. **Select Region(s)**: Choose one or more regions from the base map.
 3. **Choose Aggregate Name**: Assign a descriptive name for the new region (e.g., “Northeast Cluster”).
 4. **Add to Aggregate List**: Add the selected region(s) to your aggregate list. Repeat this step for each group you wish to create.
 5. **Finish Builing Your Aggregate Map**: Click on **Finish** to end the process and add the aggregated map to the custome map list.
 **Tip:** Aggregation refers to combining numerical or categorical data from smaller regions (like states) into a larger, custom-defined region for easier comparison or analysis.
### View All Customized Maps
Click on **View All Customized Maps** on questiosn's page to see all the custom maps created by you or the data provider.\
Each supported map type (from the Select Map dropdown) may have its own set of customized maps. Learn more about [Map Visualization on Question page](/docs/Maps-&-Visualizations/Map-Visualization-Guide)
**Tip:** Aggregation refers to combining numerical or categorical data from smaller regions (like states) into a larger, custom-defined region for easier comparison or analysis.
### View All Customized Maps
Click on **View All Customized Maps** on questiosn's page to see all the custom maps created by you or the data provider.\
Each supported map type (from the Select Map dropdown) may have its own set of customized maps. Learn more about [Map Visualization on Question page](/docs/Maps-&-Visualizations/Map-Visualization-Guide)