What Is a Trend in Statistics?
In statistics, a trend represents the general direction in which data points move over time. It shows long-term patterns or tendencies, revealing how certain values increase, decrease, or remain stable across specific periods. Trends help identify underlying behaviors that are not influenced by short-term fluctuations. In data analytics and e-commerce, recognizing these patterns can uncover critical customer, market, or operational insights — for instance, product demand cycles, seasonal purchase behavior, or user engagement patterns. Understanding trends is fundamental to making data-driven decisions. Whether you are analyzing customer feedback, sales metrics, or survey results, identifying consistent patterns over time provides a clearer picture of overall performance.Accessing The Trend Management Page
- Log in to your VoxDash Data Provider Panel.
- From the navigation tabs, select Trend Management.
The Trend Management Page
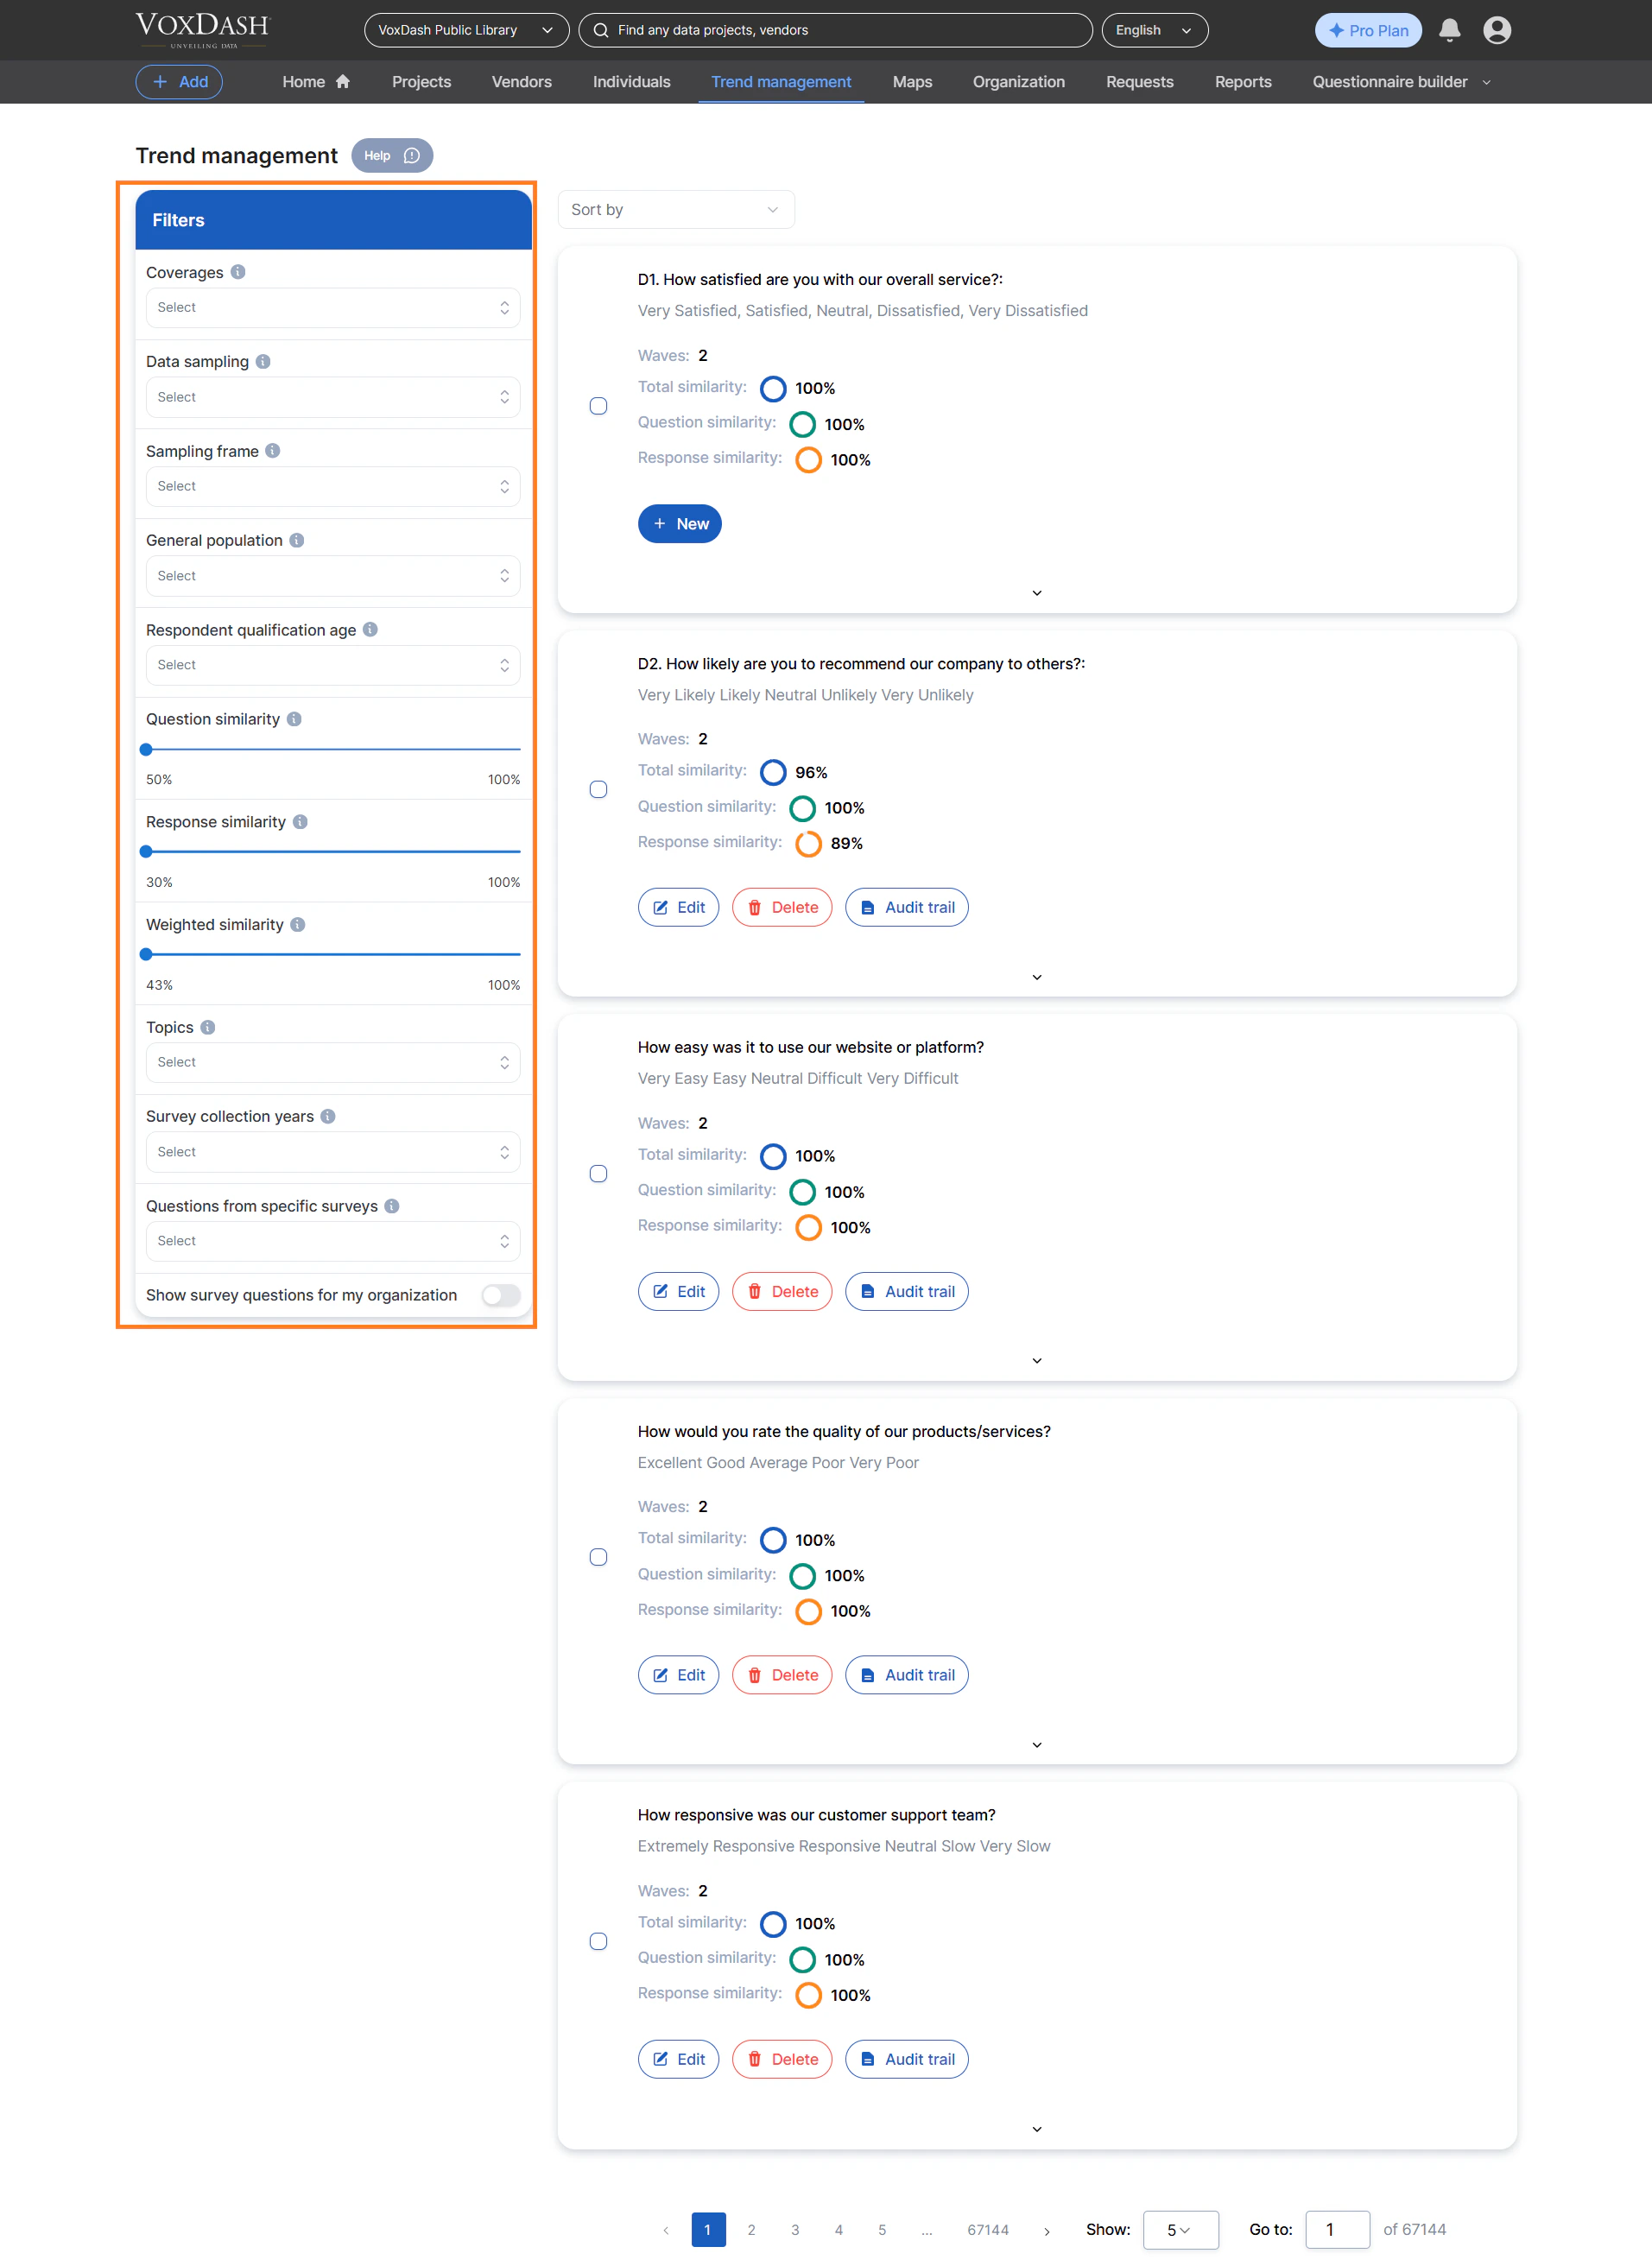
The Trend Management page is the central hub for creating and managing trends in VoxDash.This page allows you to define how data points are grouped and compared, giving you control over similarity settings, filters, and scope.

Using Filters to Define a Trend
Filters allow you to tailor how VoxDash calculates and visualizes trends across datasets.They help you focus on specific insights that align with your goals, such as analyzing customer sentiment across surveys or tracking product performance over months.
Available Filters
Filters are essential for precisely shaping your trend analysis, allowing you to segment data and focus on the most relevant patterns. VoxDash provides a comprehensive set of filters to refine your trends. Here are the available filters:- Coverage: Define the geographical or operational scope of your data. This helps in analyzing trends specific to certain regions or markets.
- Data Sampling: Specify the method used for data sampling (e.g., random sampling, stratified sampling). This helps in understanding the statistical basis of the trends.
- Sampling Frame: Indicate the source or framework from which your data sample was drawn. This is crucial for assessing the representativeness of your trends.
- General Population: Use this filter to compare trends against a broader demographic or population benchmark, if applicable.
- Respondents Qualification Age: Narrow down your analysis to specific age groups among respondents, essential for demographic trend analysis.
- Topics: Select topics defined in your data profile (e.g., customer satisfaction, product feedback, market sentiment). This allows you to isolate trends within specific subject areas.
- Survey Year Collection: Filter trends based on the year the survey data was collected. This is key for observing year-over-year changes and long-term patterns.
- Questions from Specific Surveys: Choose questions from one or more surveys to analyze. This is particularly useful for tracking how similar questions evolve over time or across different survey contexts.
- Show Survey Questions from My Organization: This filter allows you to specifically include or exclude questions that have been internally defined or custom-created by your organization, ensuring proprietary data is handled appropriately.
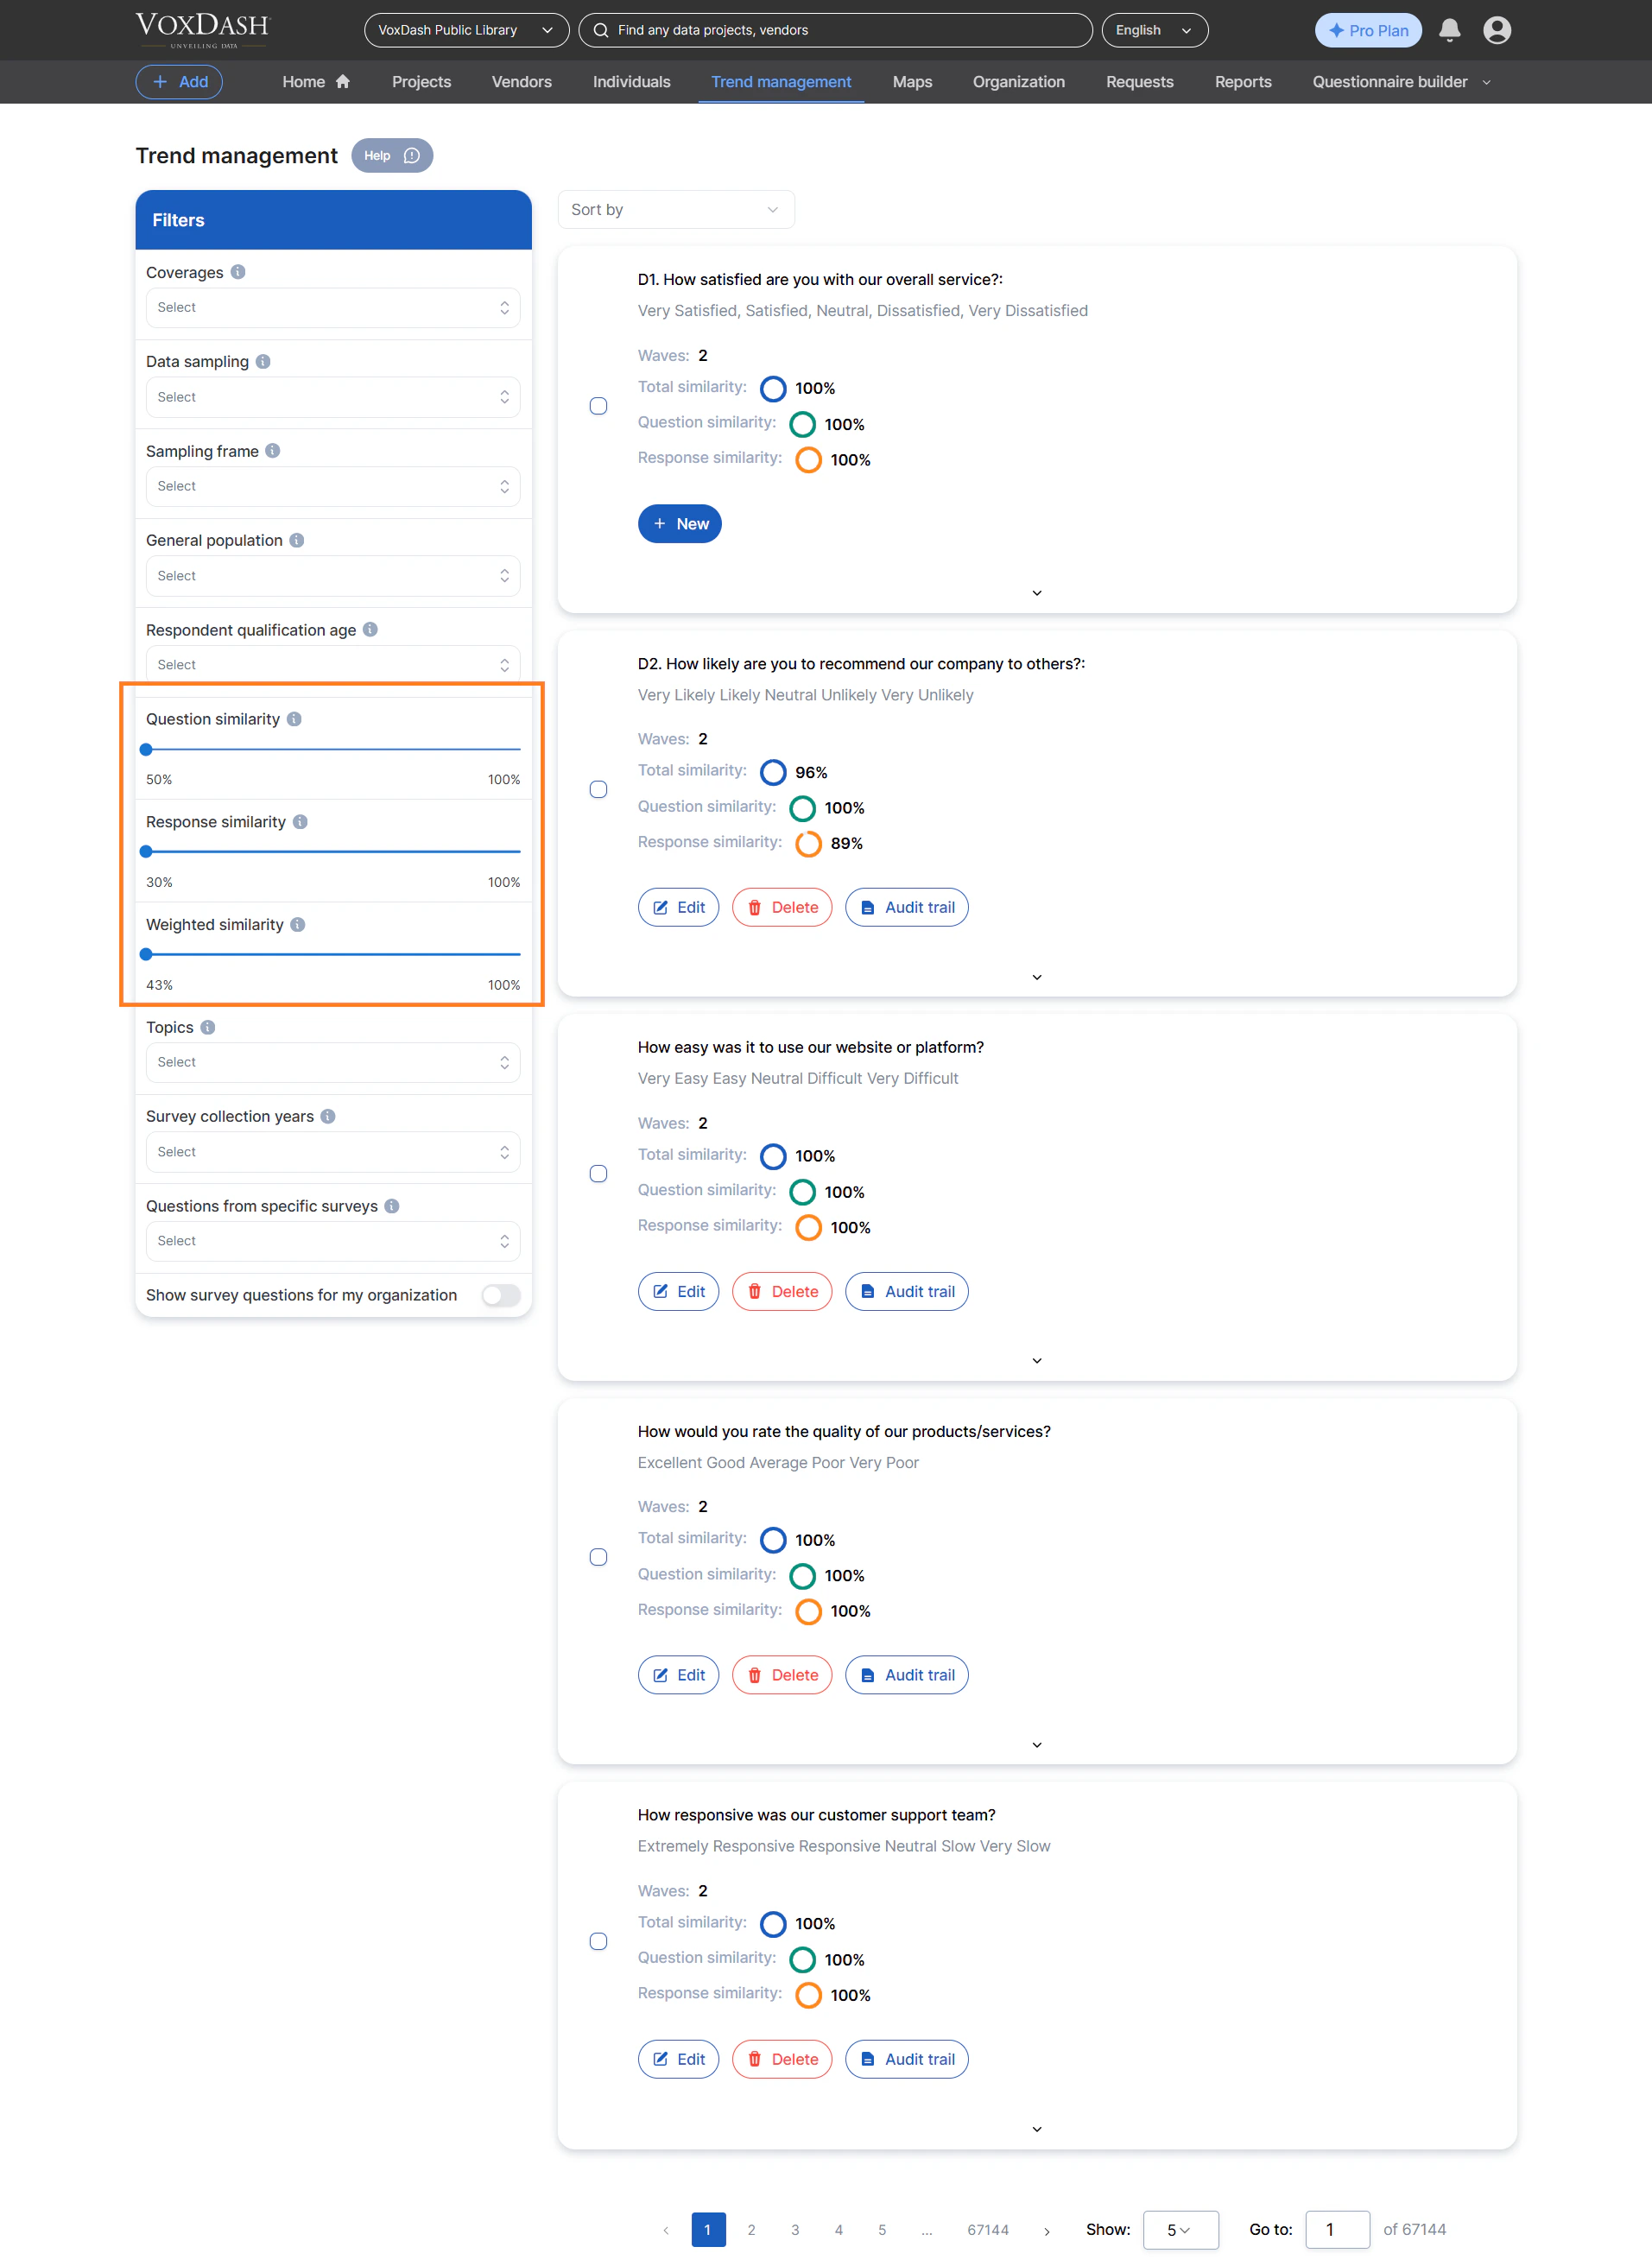
- Question Similarity: This setting determines how closely matched questions must be to be included in the same trend. A higher percentage means questions must be very similar in wording and intent.
- Response Similarity: This filter defines the threshold for matching responses to a question. Setting a high percentage ensures that only very similar answers are grouped together for trend analysis.
- Weighted Similarity: This advanced option allows you to assign different importance (weights) to question similarity and response similarity, giving you granular control over how trends are calculated based on combined matching criteria.
How to Create a Trend
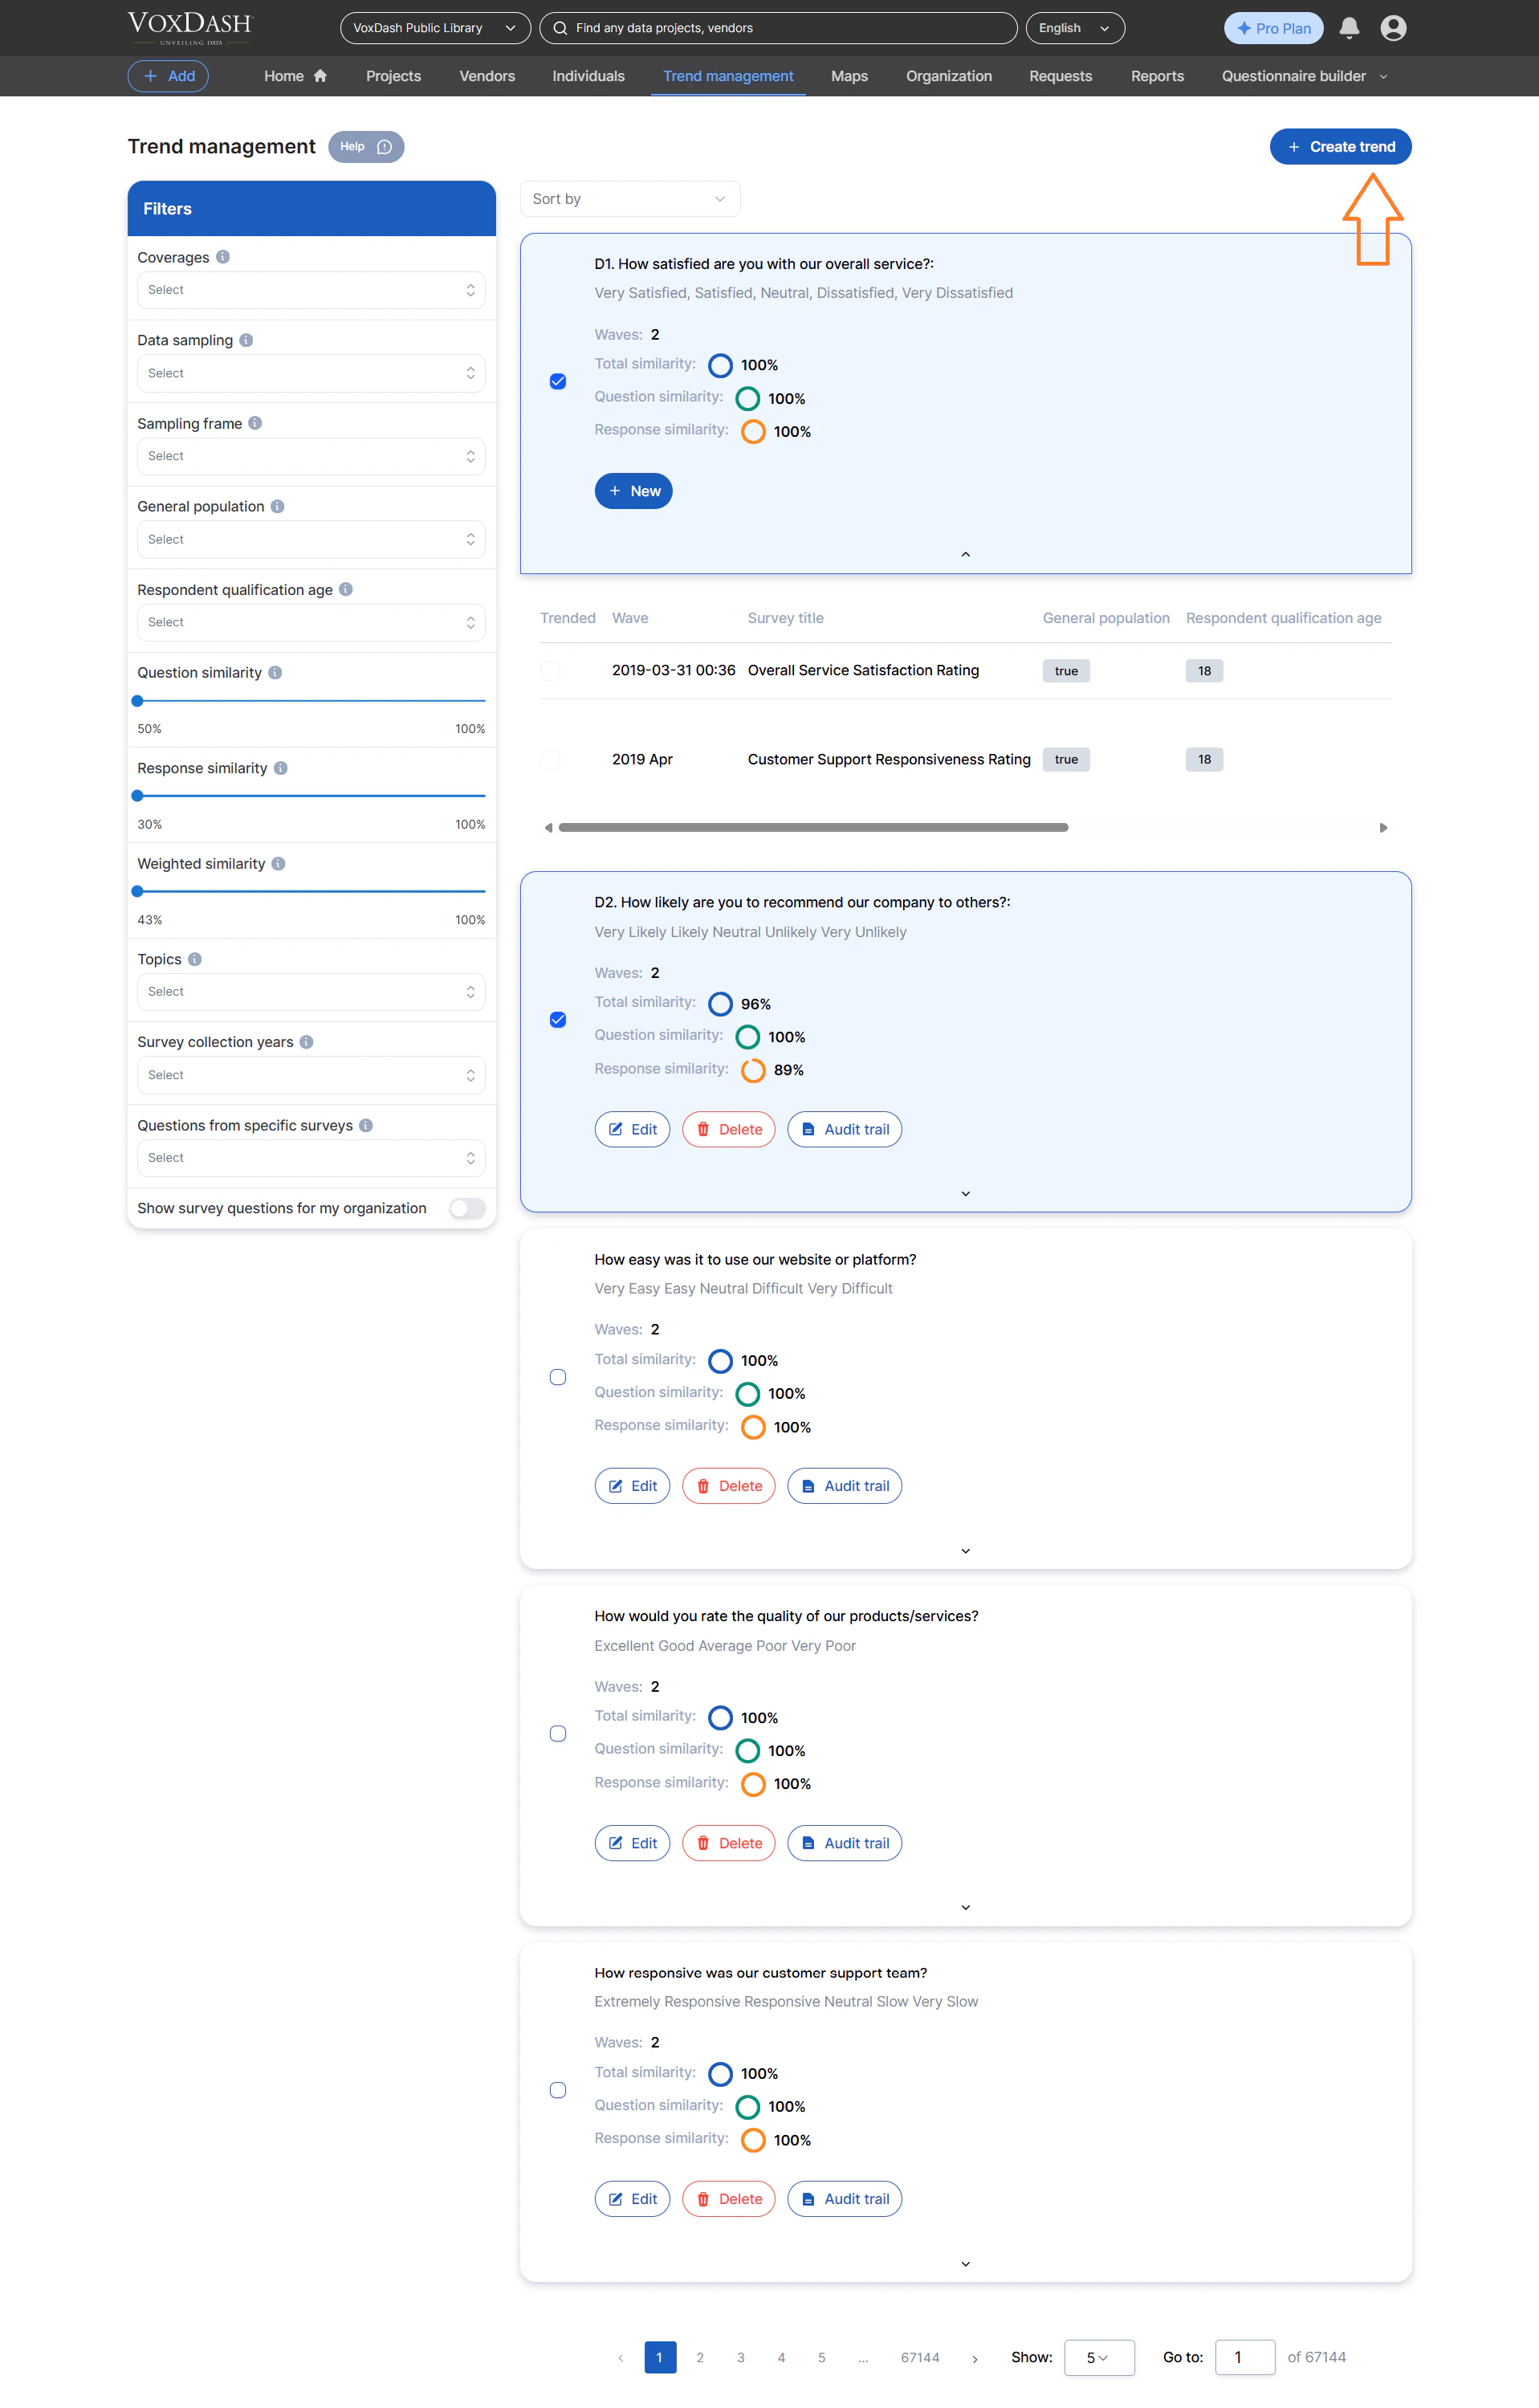
VoxDash offers two main methods for creating trends. You can either combine multiple questions into one unified trend or link surveys to a single question for focused longitudinal analysis.1. Create a Multiple‑Question Trend
This approach lets you analyze several related questions together to identify shared movement patterns. Steps:- Review relationships and similarities between target questions across surveys.
- Select multiple questions relevant to your objective.
- Click the Create Trend button in the top‑right corner of the page.
- VoxDash automatically groups and analyzes the selected questions, generating a consolidated trend.
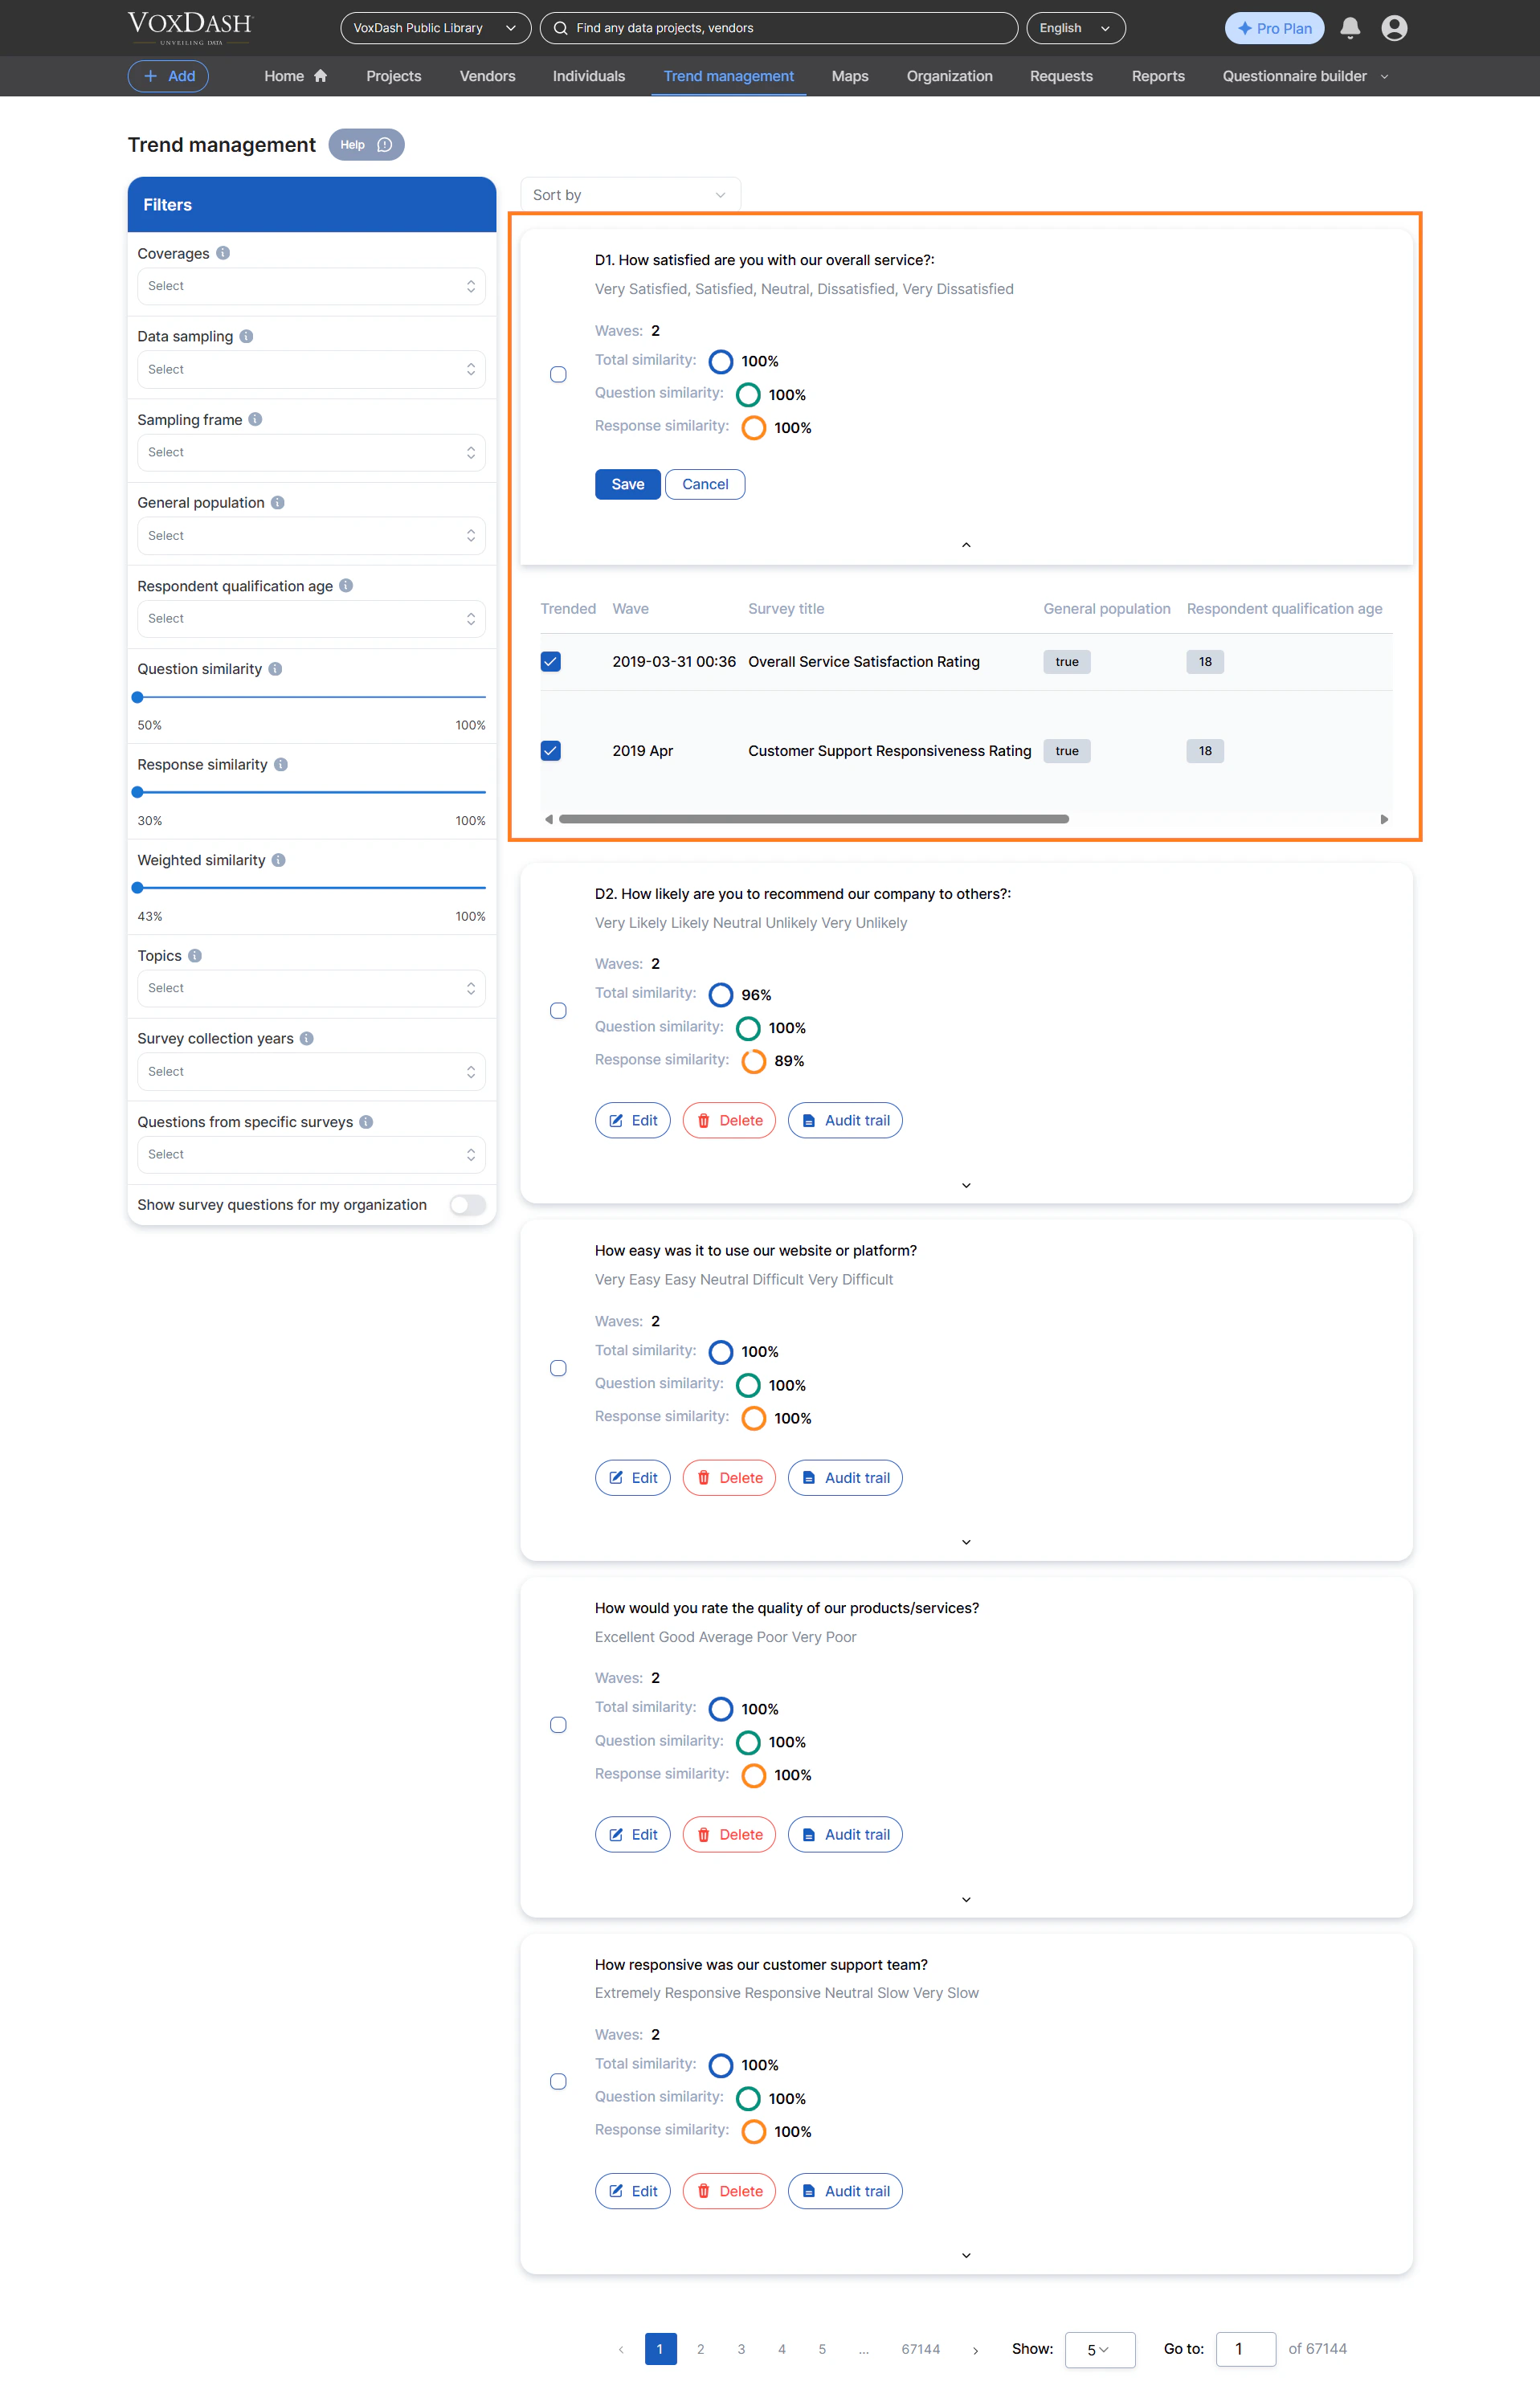
2. Add Surveys to a Single Question
This method builds a trend around one specific question but tracks its responses across multiple surveys — ideal for longitudinal tracking. Steps:- Find the question you want to trend.
- Click the New button next to it.
- Select all relevant surveys that include the same or similar question wording.
- Once ready, click Save. VoxDash will create a trend based on response changes over time.
Visualizing Trends in VoxDash
After creating a trend, its data is displayed in an interactive visual report.Each visualization reveals how responses change over time, enabling quick interpretation of evolution patterns.
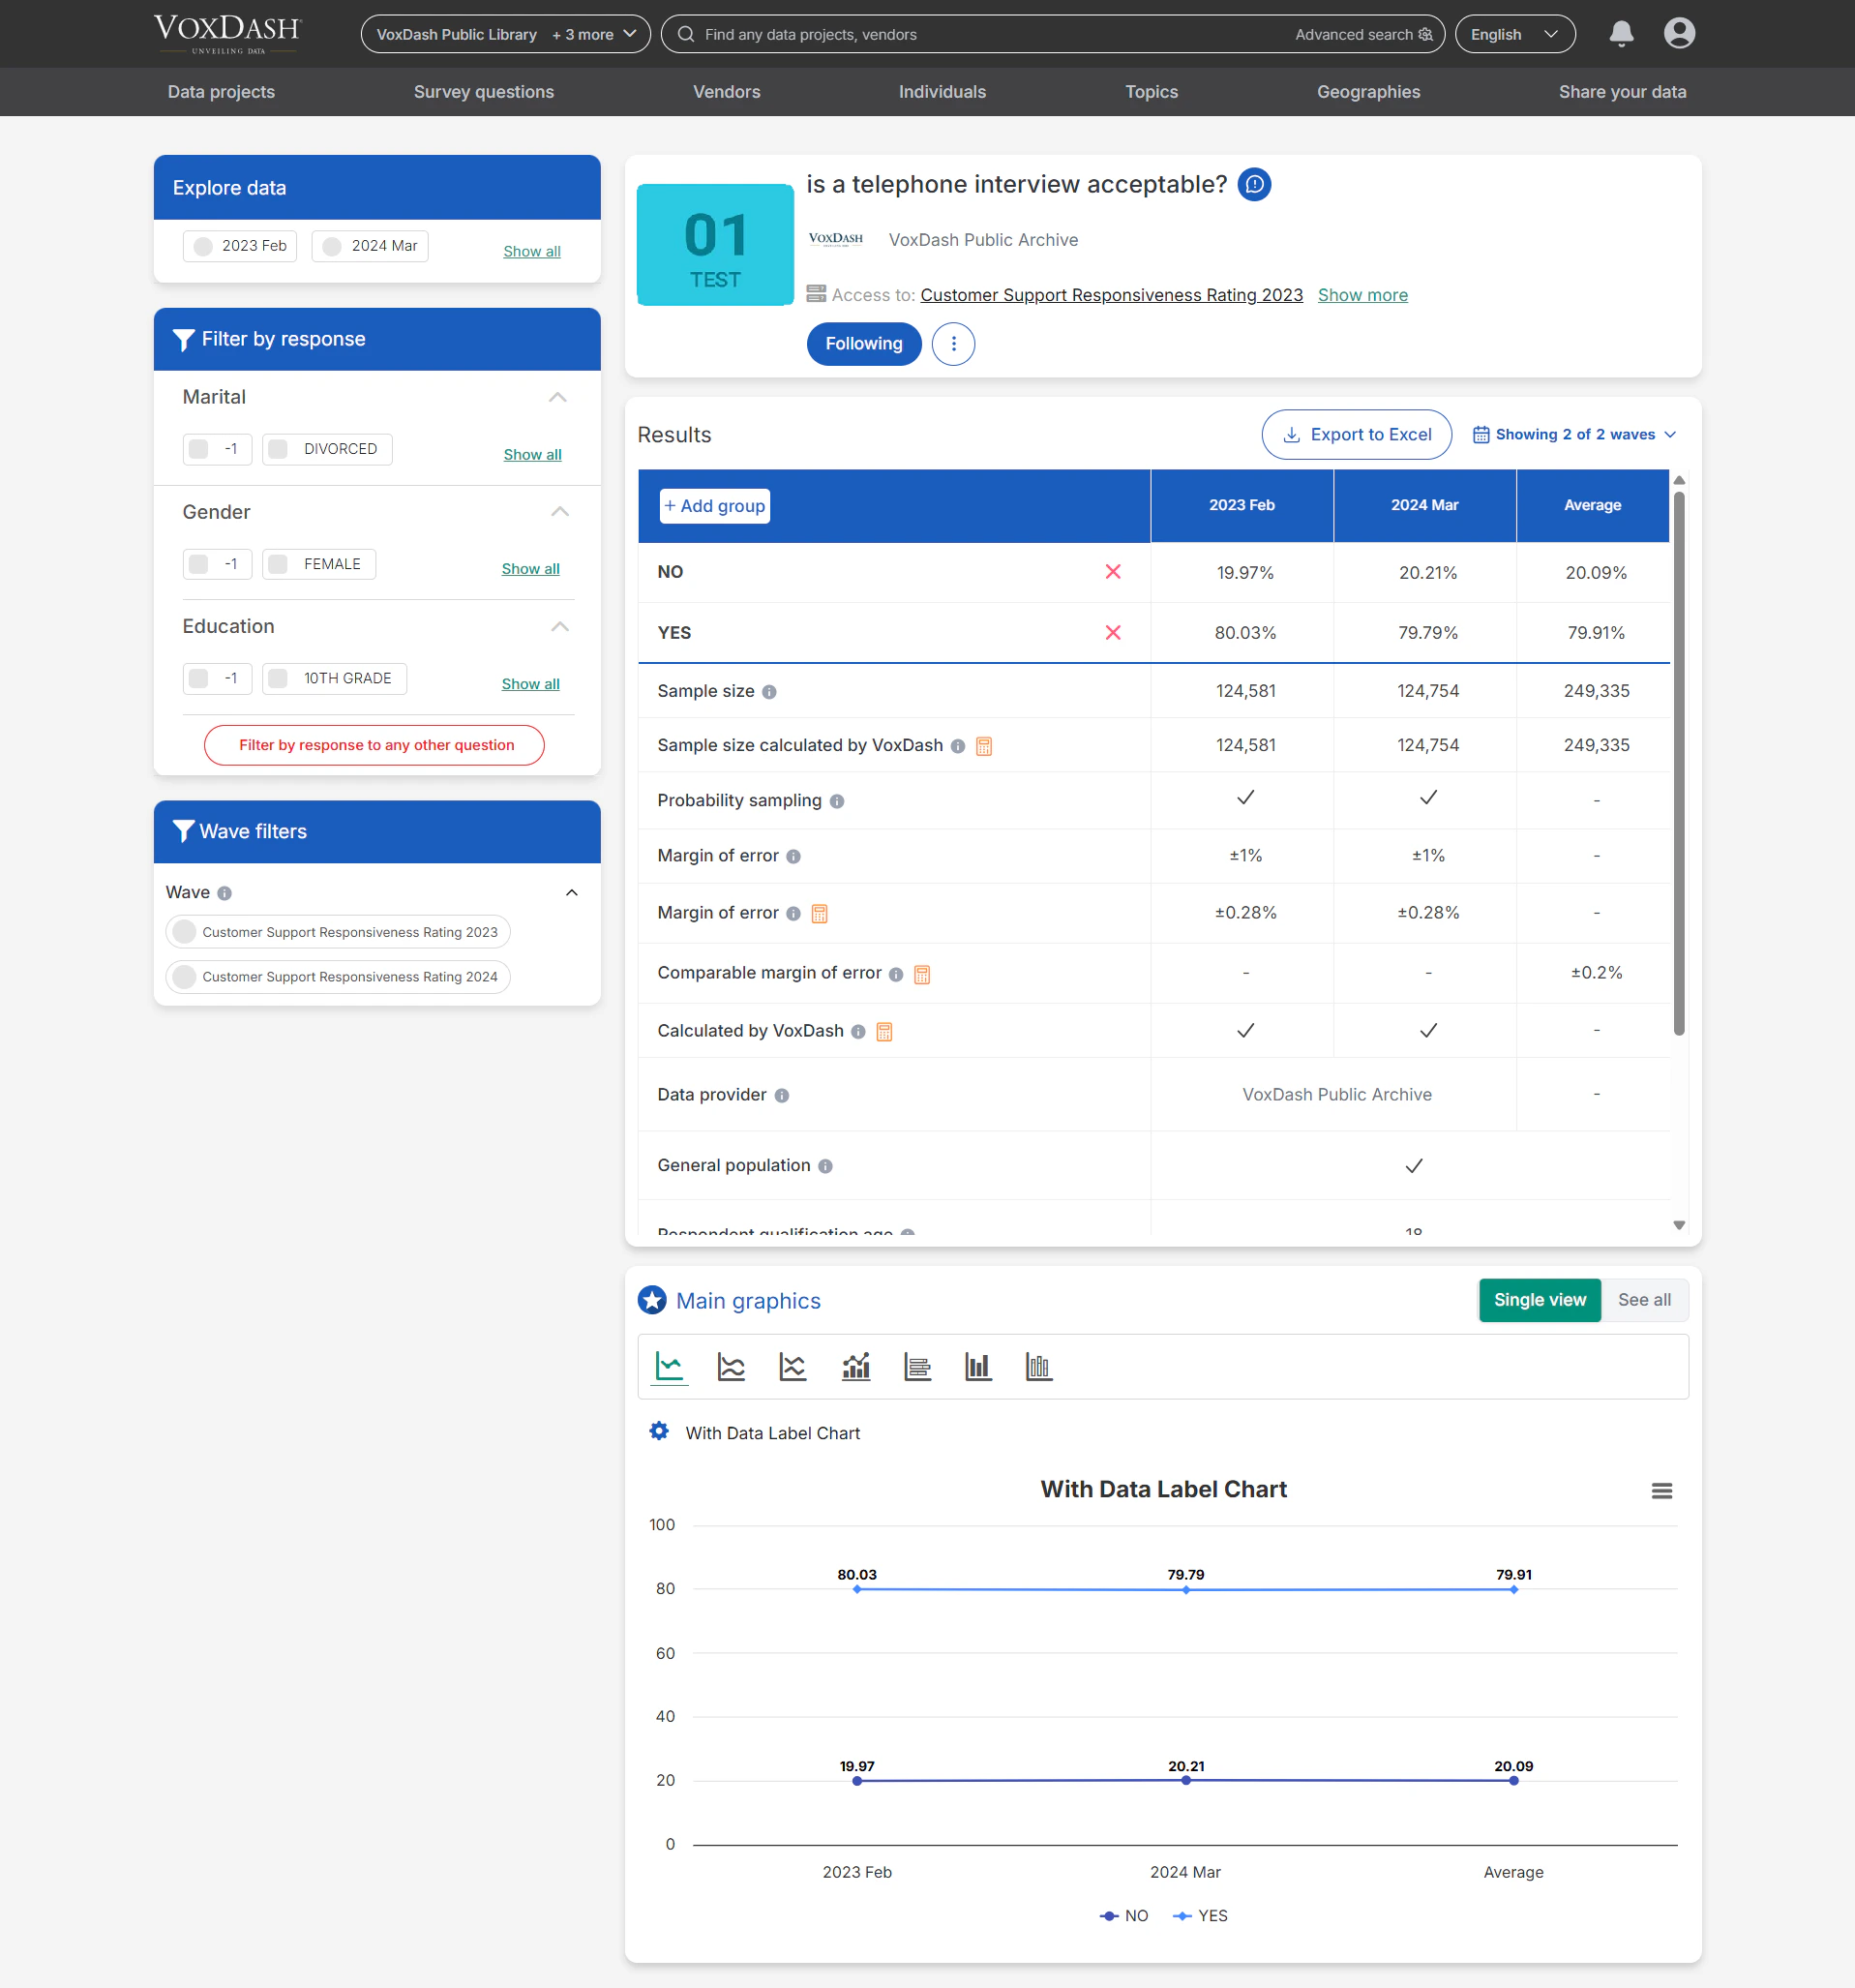
Key Features:
- Yearly Analysis: Trends for each question show response percentages or values for each year (or survey period).
- Clickable Dates: Each date in the chart or table is interactive — select it to view detailed breakdowns for that specific period.
- Comparative Insights: You can compare multiple trend lines simultaneously to see how different questions or topics evolve together.
- Dynamic Graphs: Charts are responsive and update automatically when filters or similarity settings change.