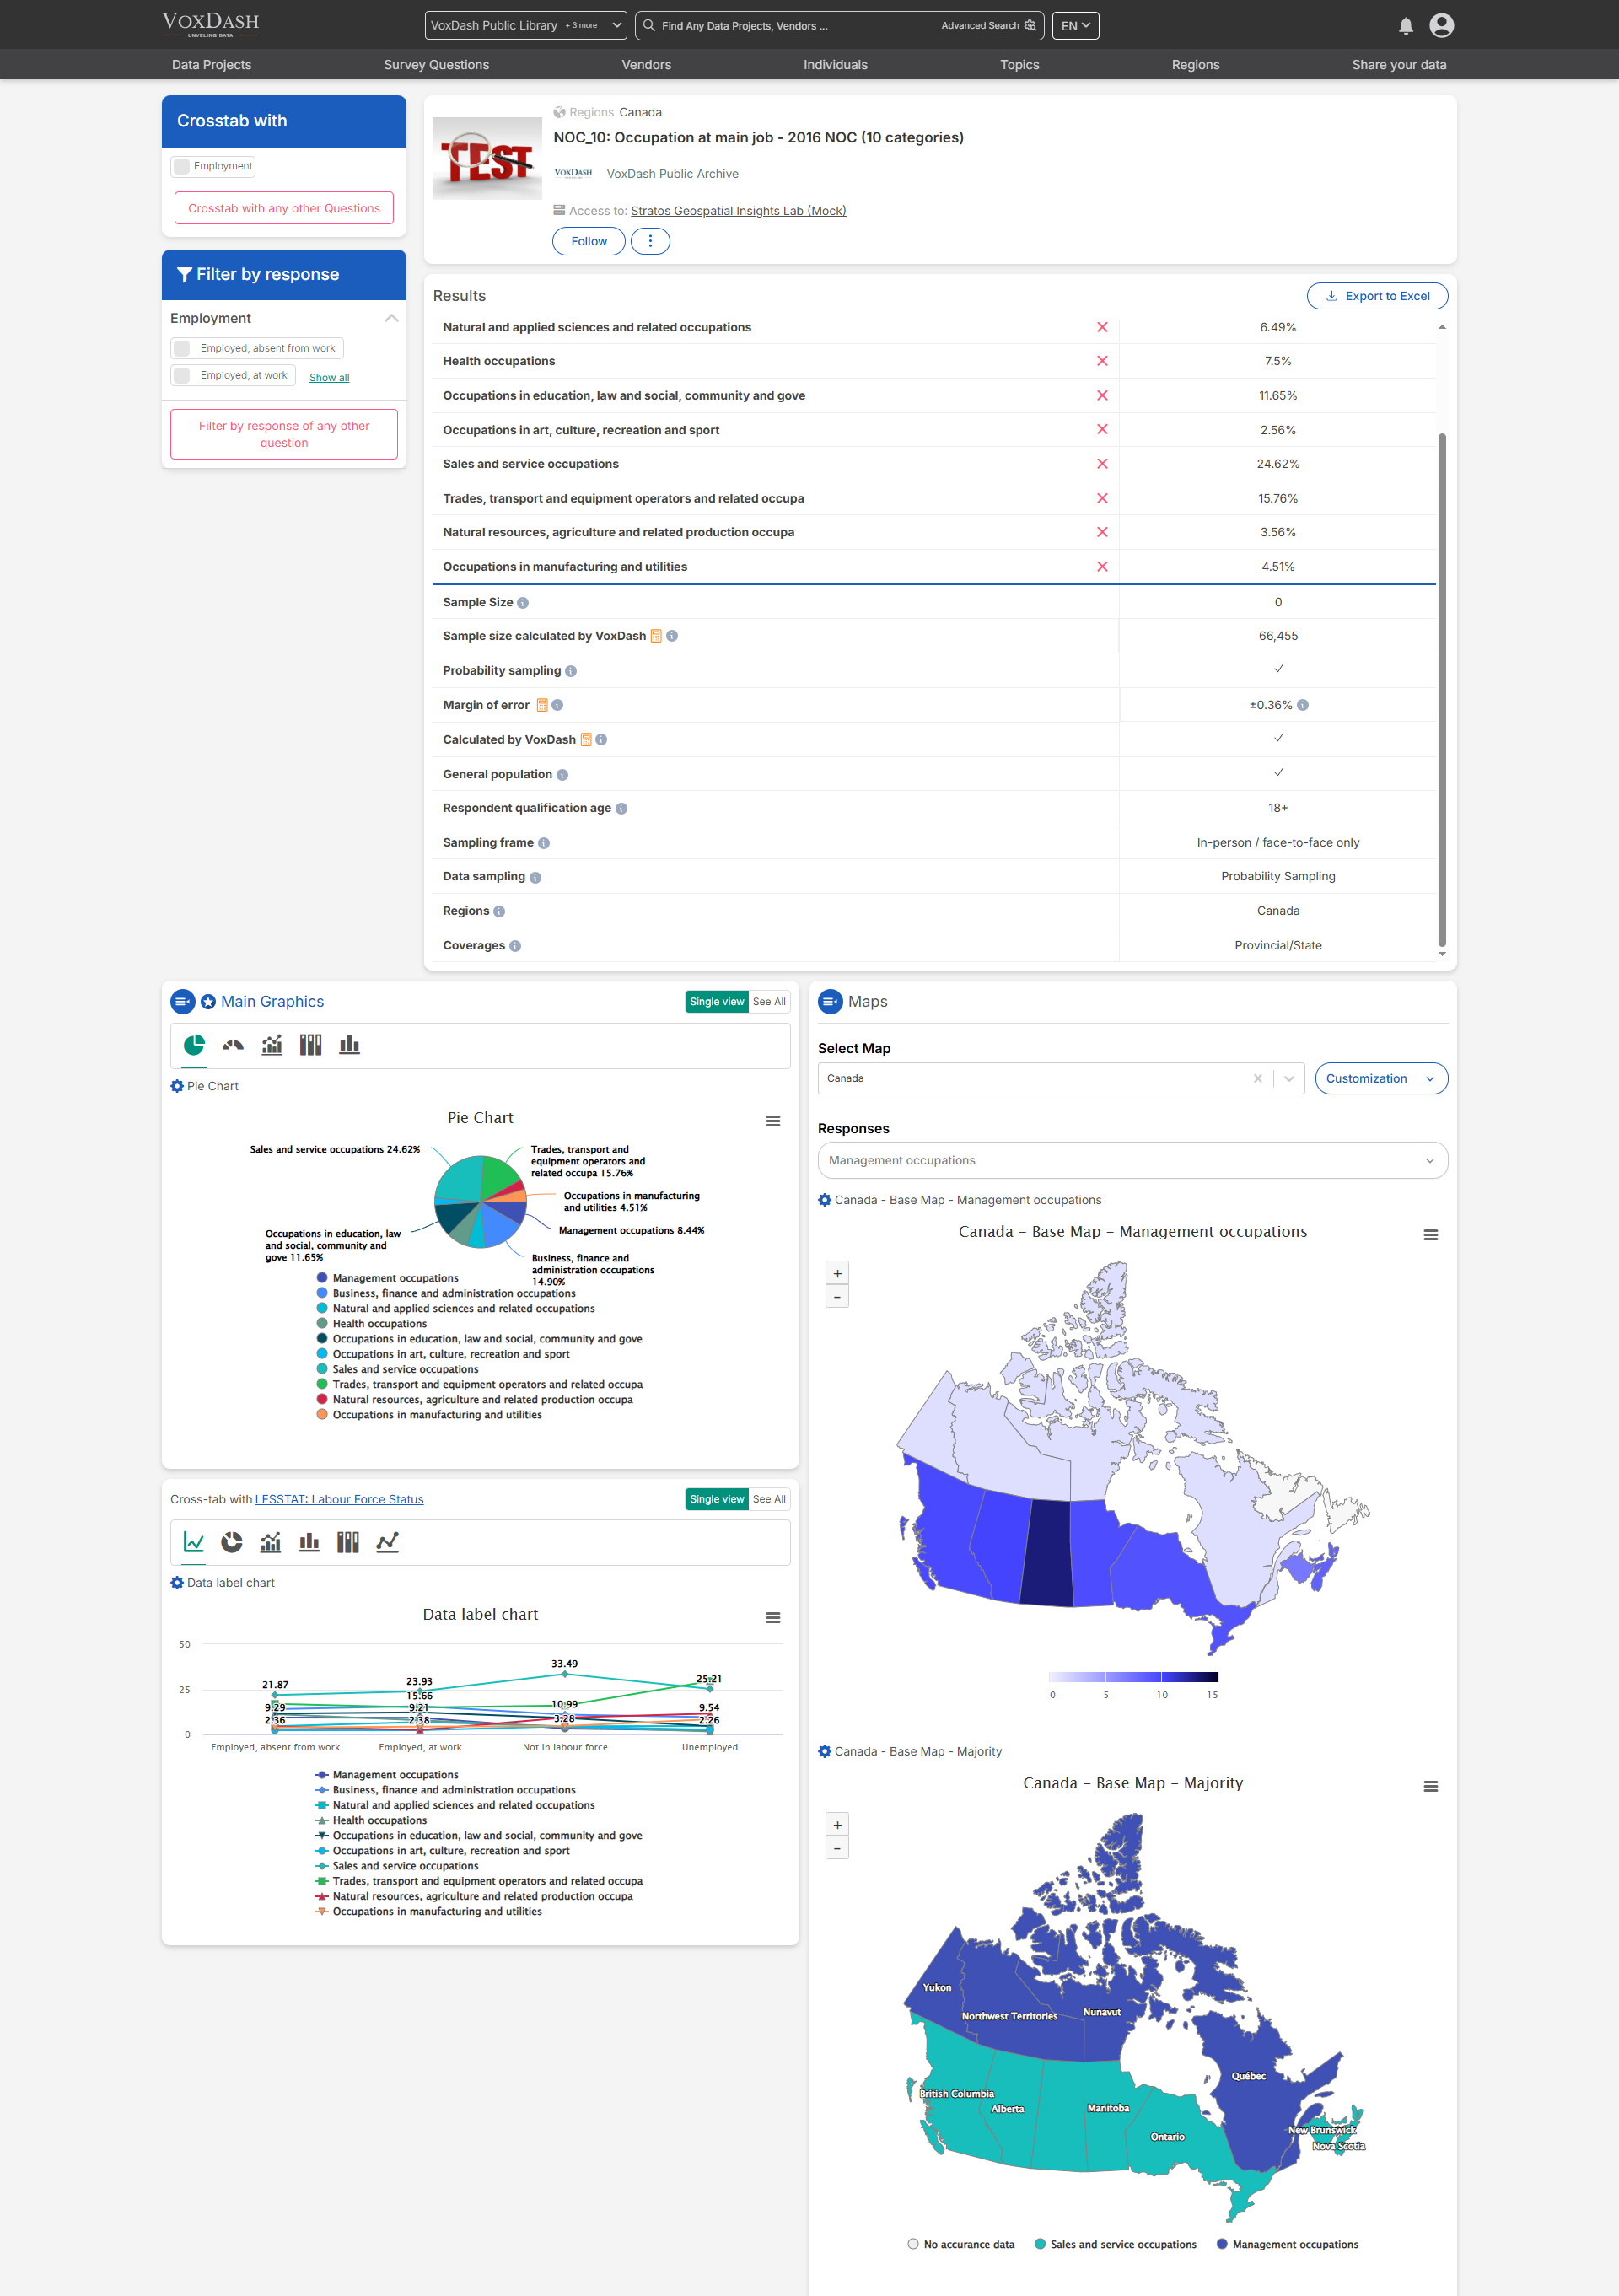
Select Map:
The Select Map dropdown lists all the maps available for the current survey project. Each map type represents a different way of visualizing your data. Choose the one that best fits your analysis needs.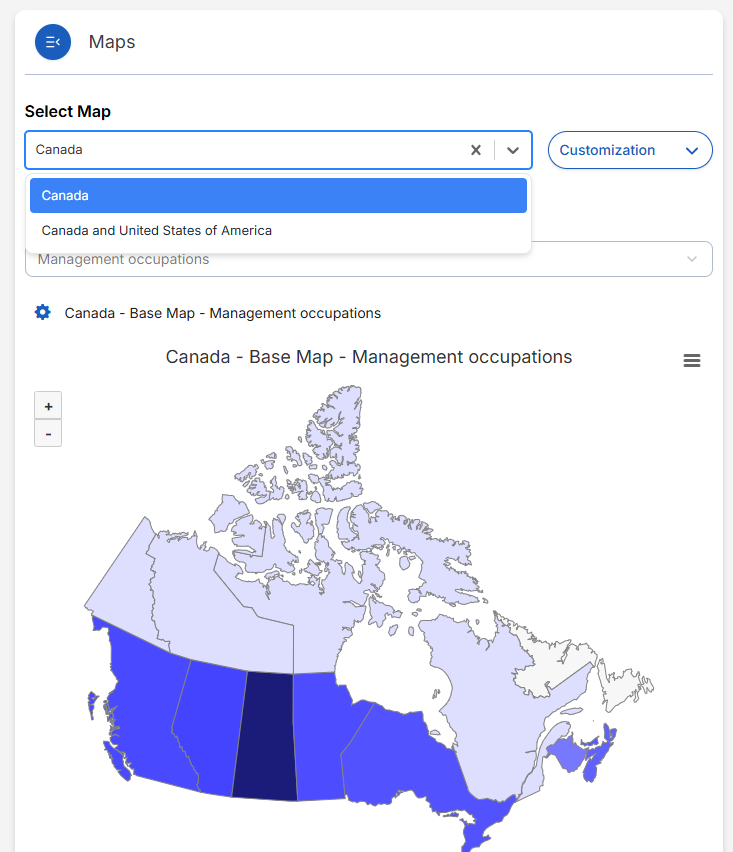
Types of Maps in VoxDash
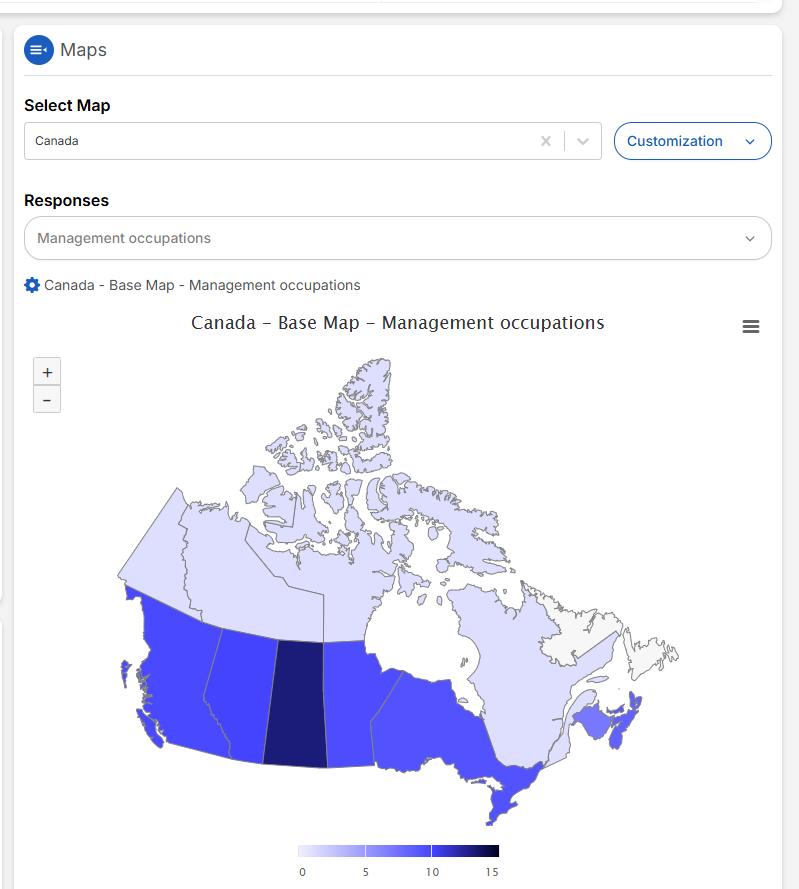
Base map:
The Base Map shows the percentage of responses by state or region. This provides a quick overview of where most responses come from. You can configure the base map to display:- All Responses: Shows the overall response rate for each region.
- Specific Responses: Filters the view to display results for a selected question or answer option.
Majority map:
The Majority Map highlights each state or region based on the most frequently selected response. Each response option is color-coded, making it easy to identify dominant preferences and regional differences at a glance. For example: States where most respondents selected “Sales and service occupation” will appear in green color. States where “Management occupation”” was the dominant answer will appear in blue. This view helps users instantly identify which opinions or responses prevail in different geographic areas.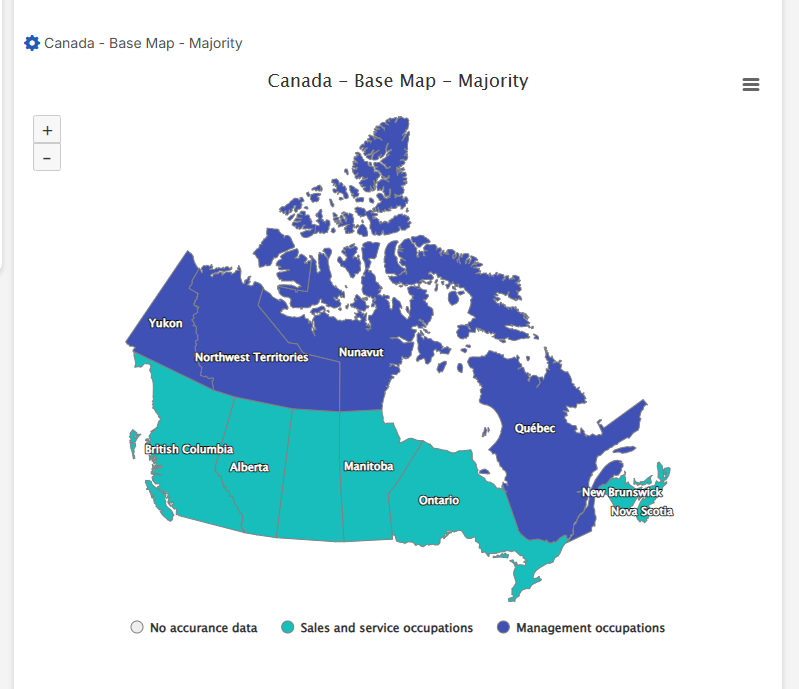
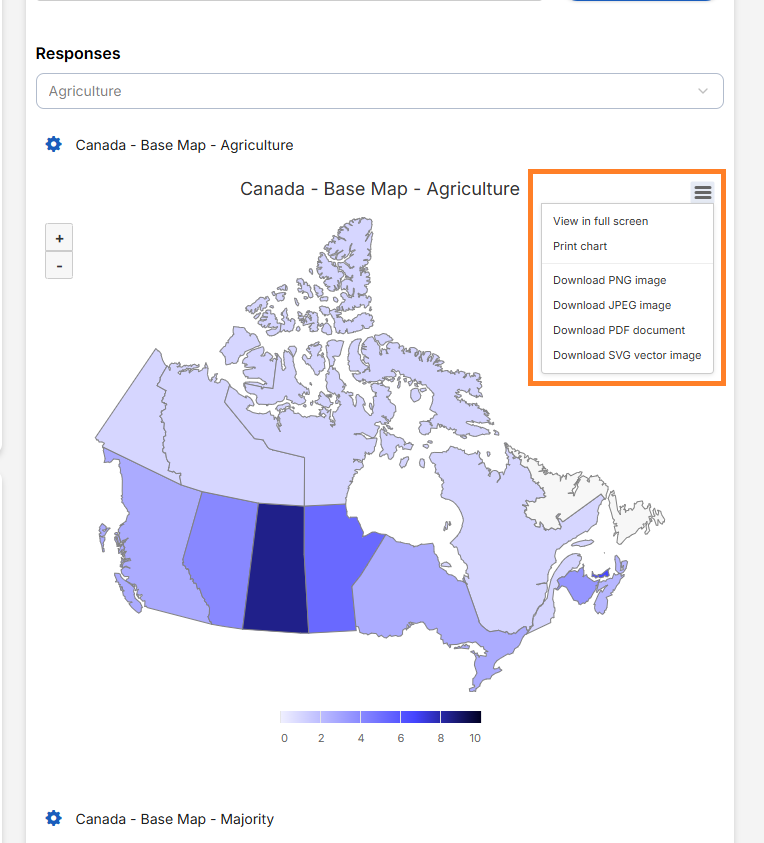
Filtering Maps by Responses
The Responses Select Box allows you to refine what data is displayed on the map. This is especially useful when a question includes multiple answer options and you want to focus on one or more specific responses.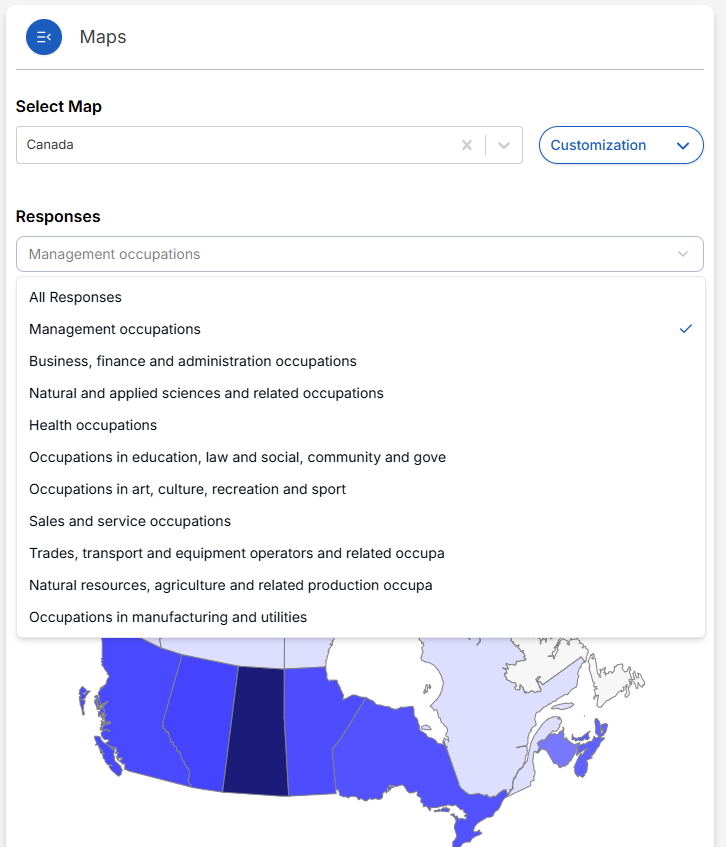
Customization
Customized maps allow you to create aggregated regions, combining multiple states or territories into new, meaningful geographic groupings. This is especially useful for organizations or studies that analyze data across custom territories, sales regions, or combined areas (e.g., “East Coast” or “Western Provinces”). In customization you can: 1. Create a new aggregated map based on your needs. 2. View previously aggregated maps provided by VoxDash’s admins. Notes:- You can add customized map during survey data entry process. Learn more here.
- You must be logged into your account to access customization features.
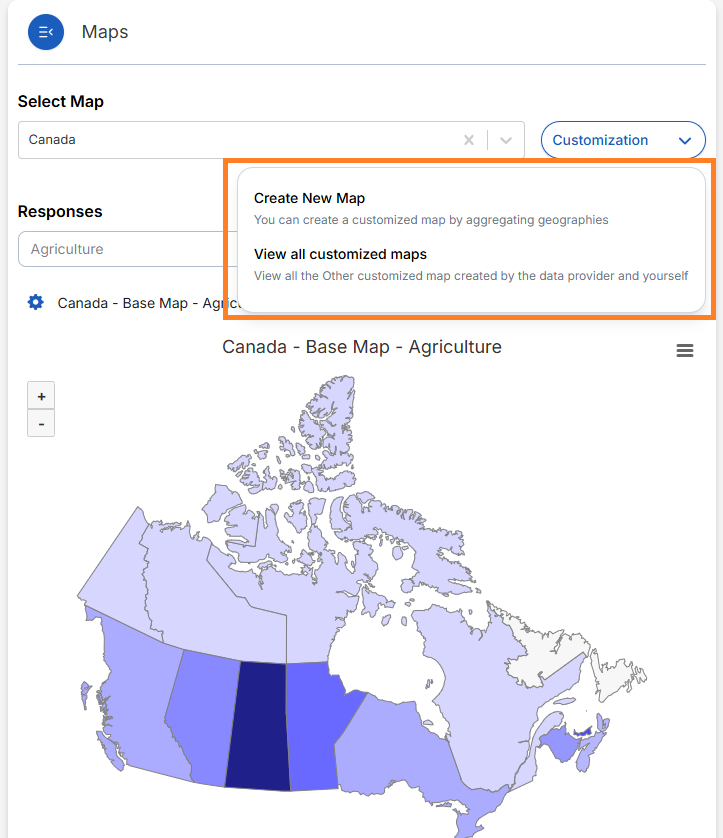
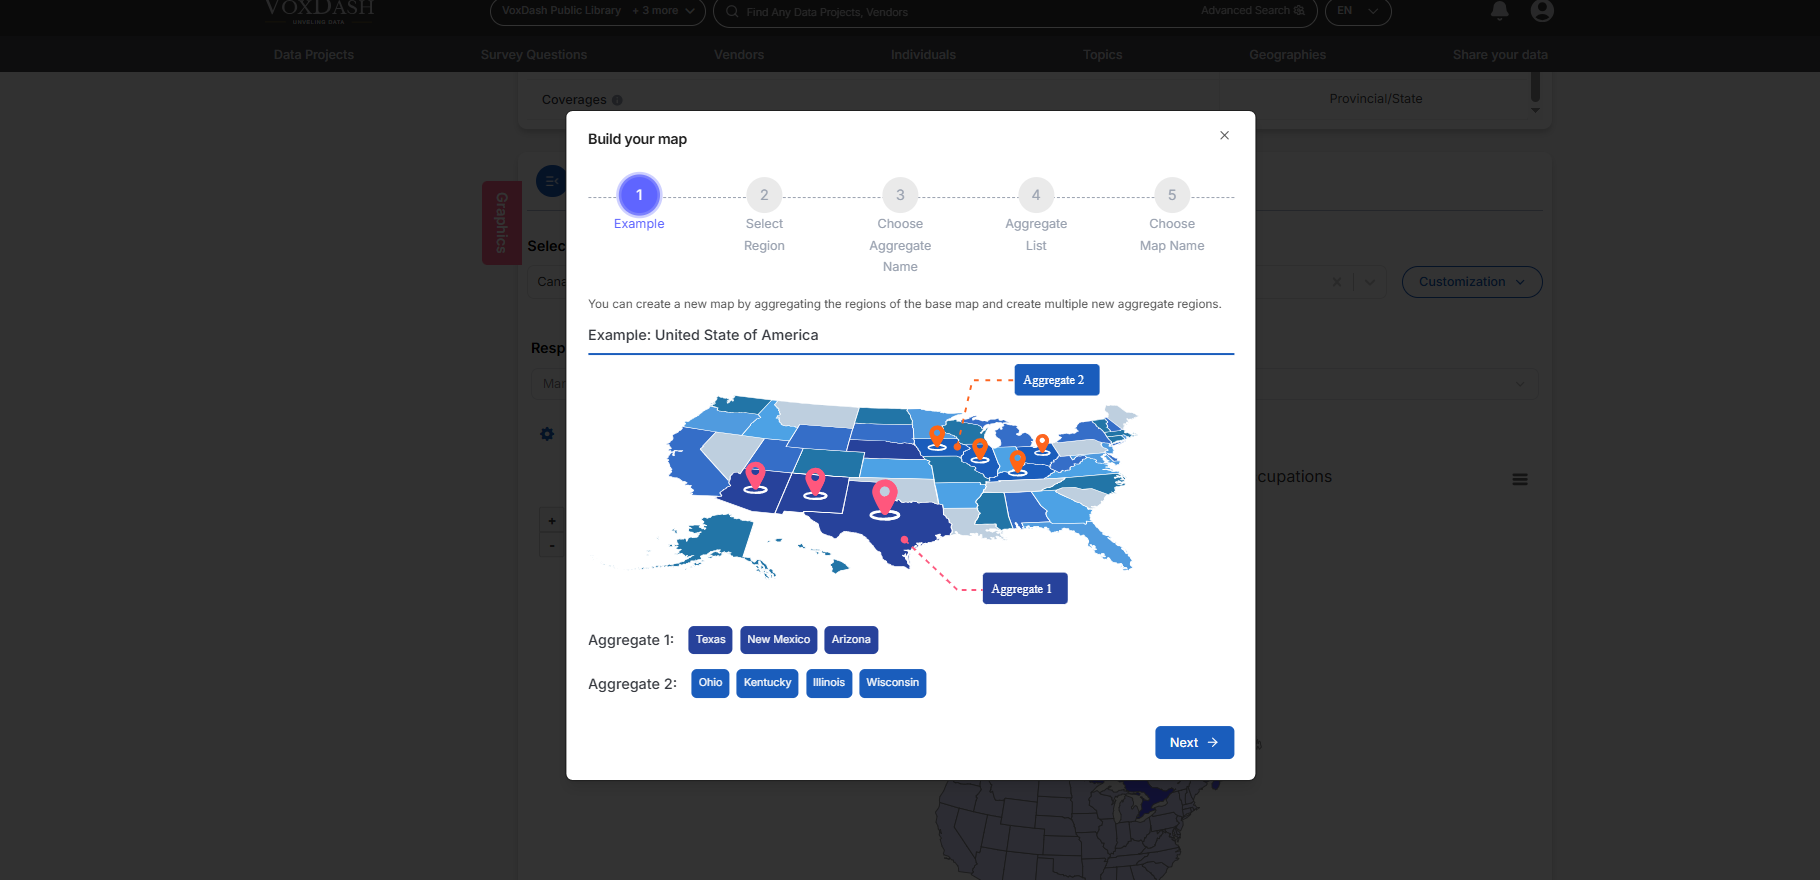
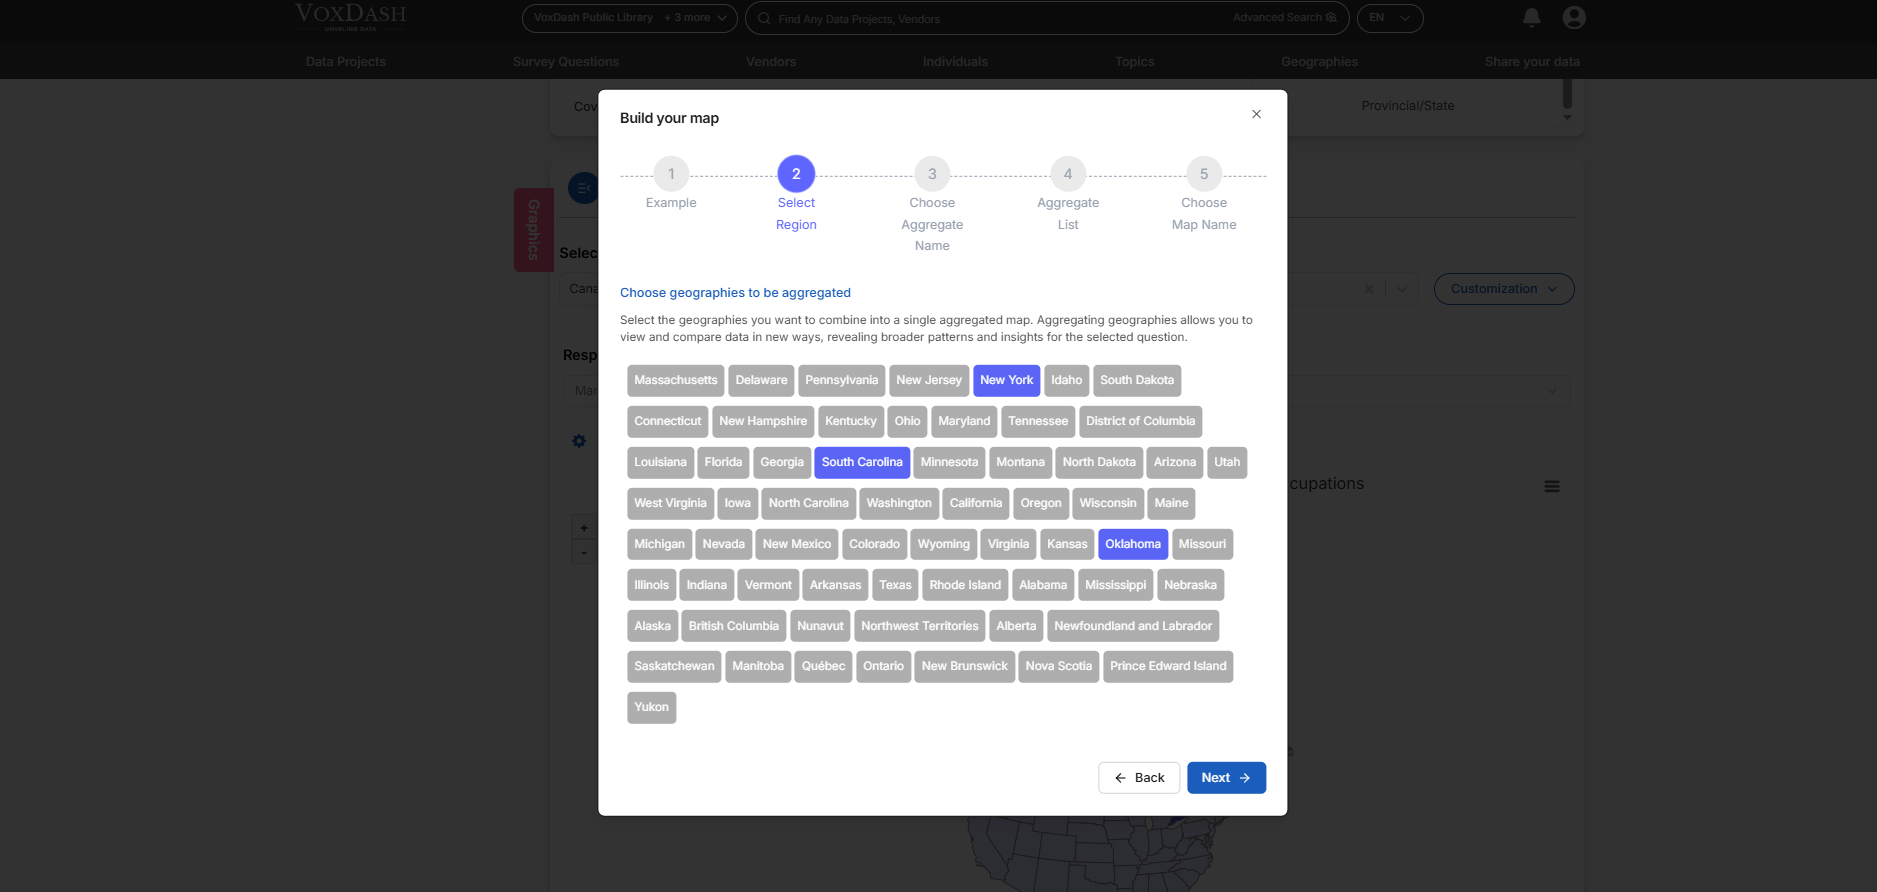
Creating a New Customized Map
You can create a custom map by grouping multiple regions from the base map into new aggregated regions. This is useful when you want to analyze combined areas or custom territories. Follow these steps to create a custom map:- Select Region(s): Choose one or more regions from the base map.
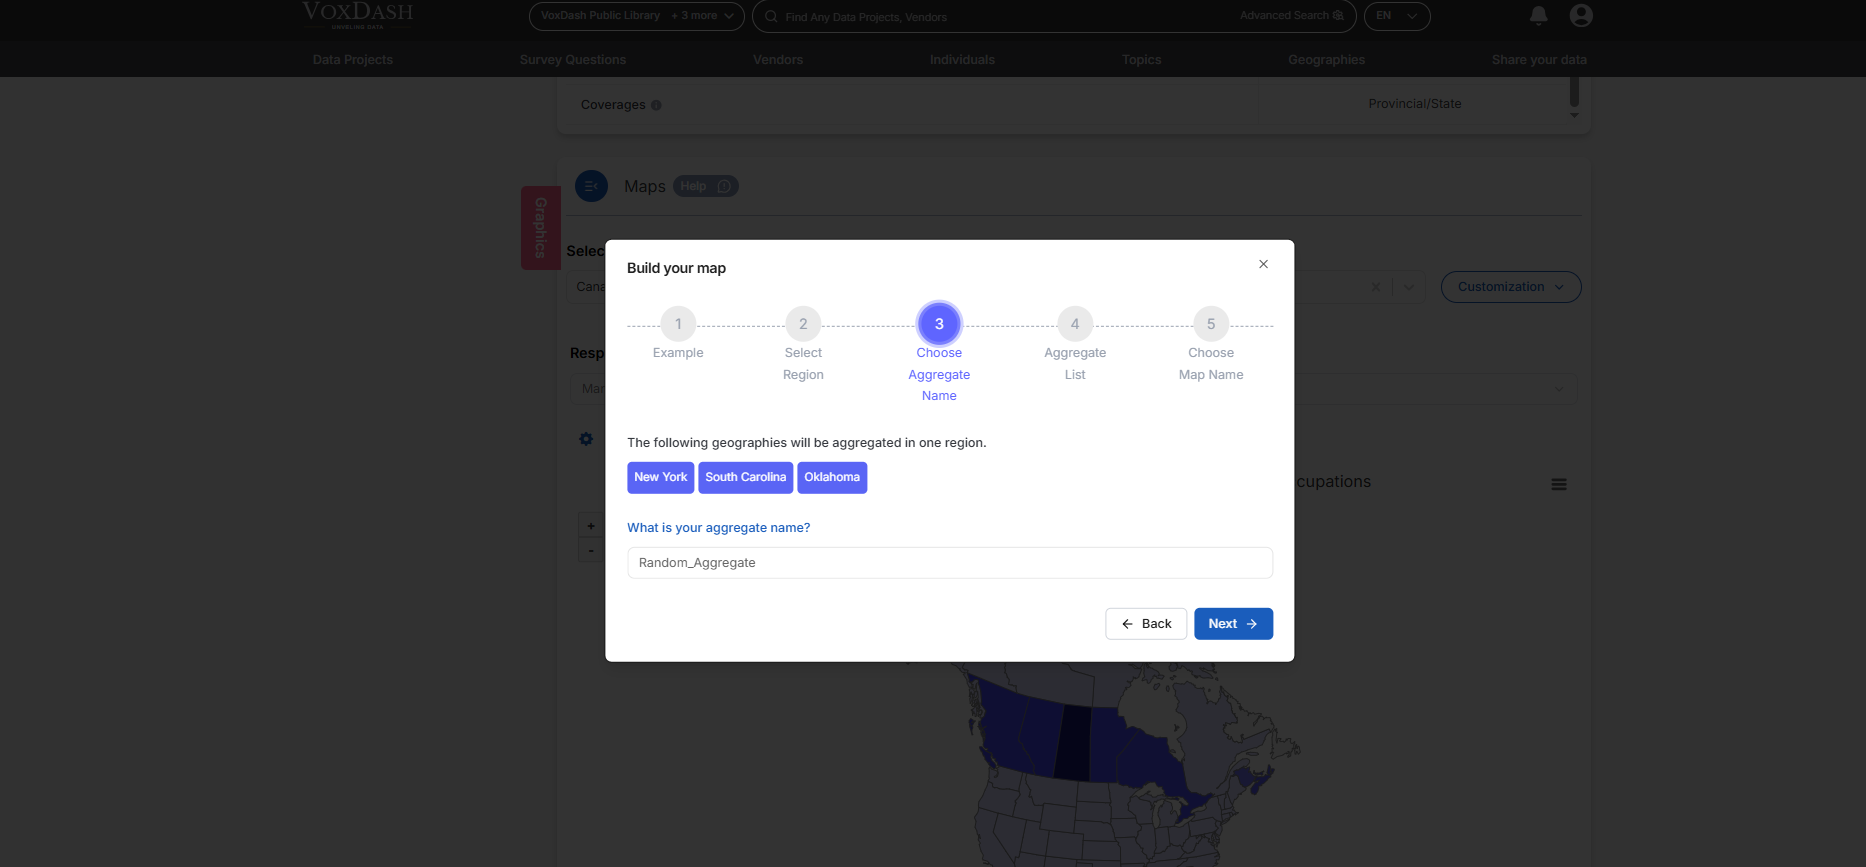
- Choose Aggregate Name: Assign a descriptive name for the new region (e.g., “Northeast Cluster”).
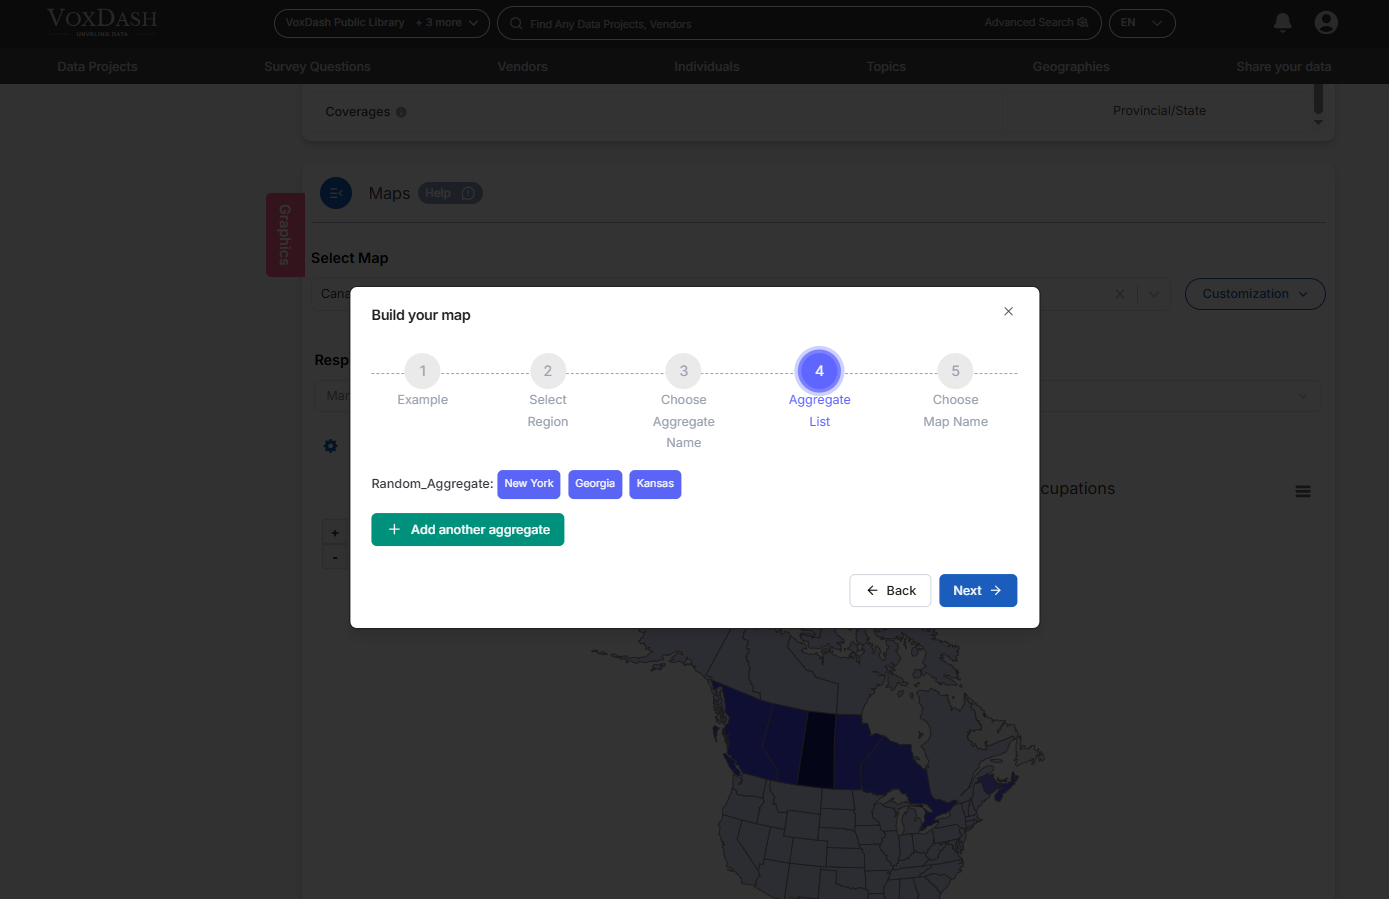
- Add to Aggregate List: Add the selected region(s) to your aggregate list. Repeat this step for each group you wish to create.
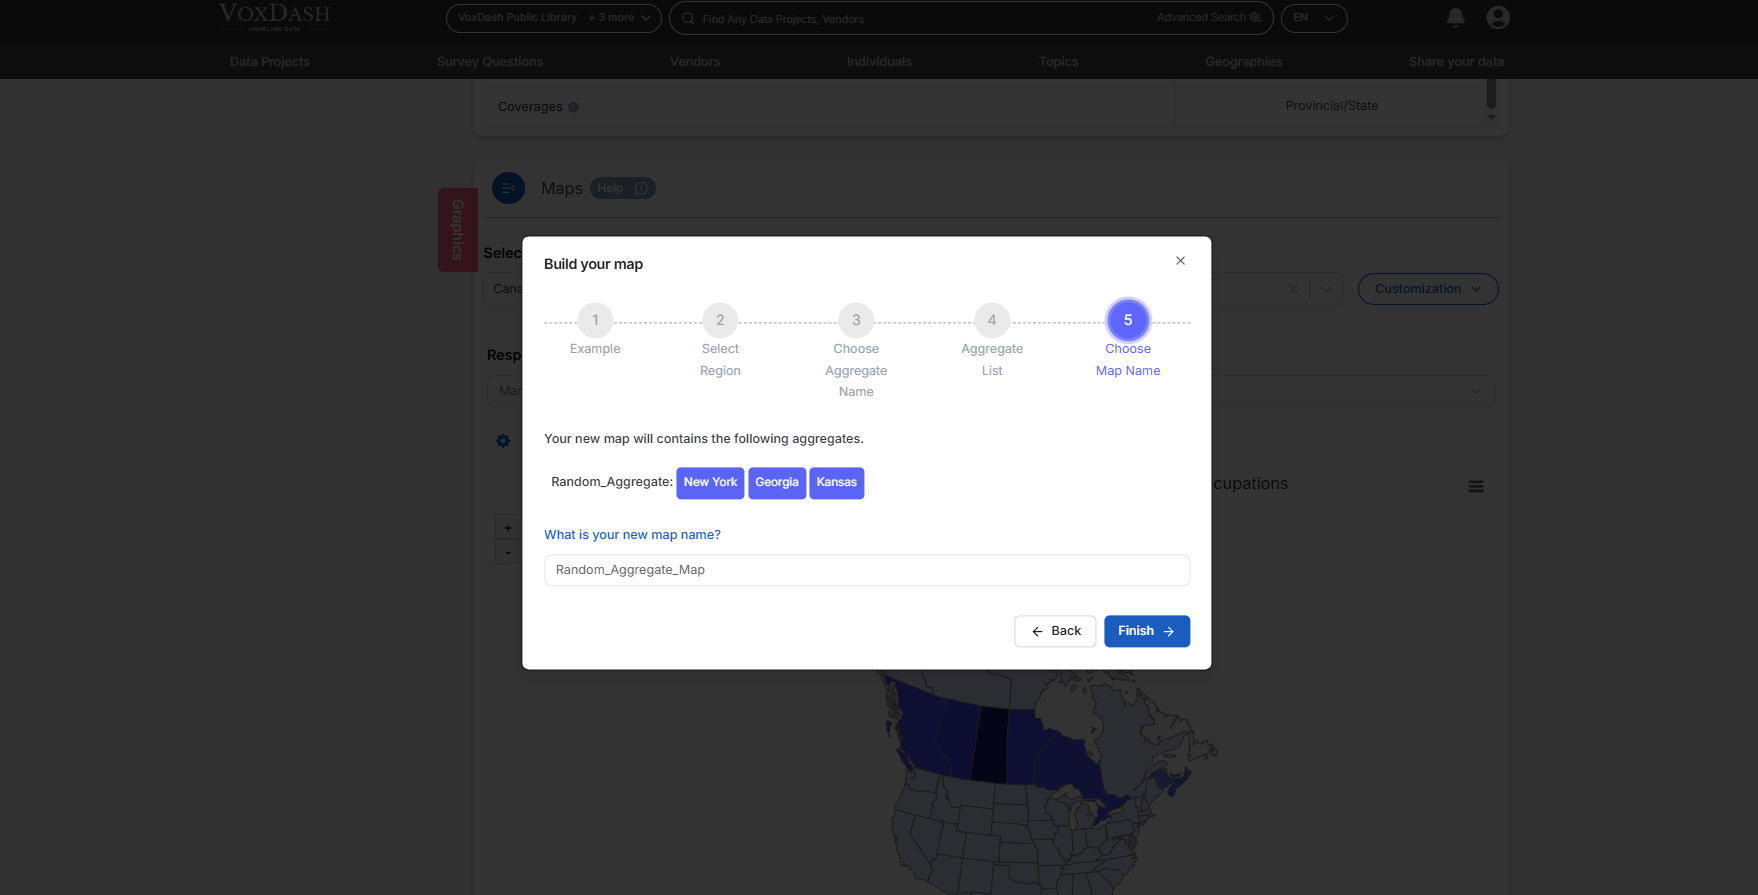
- Finish Builing Your Aggregate Map: Click on Finish to end the process and add the aggregated map to the custome map list.
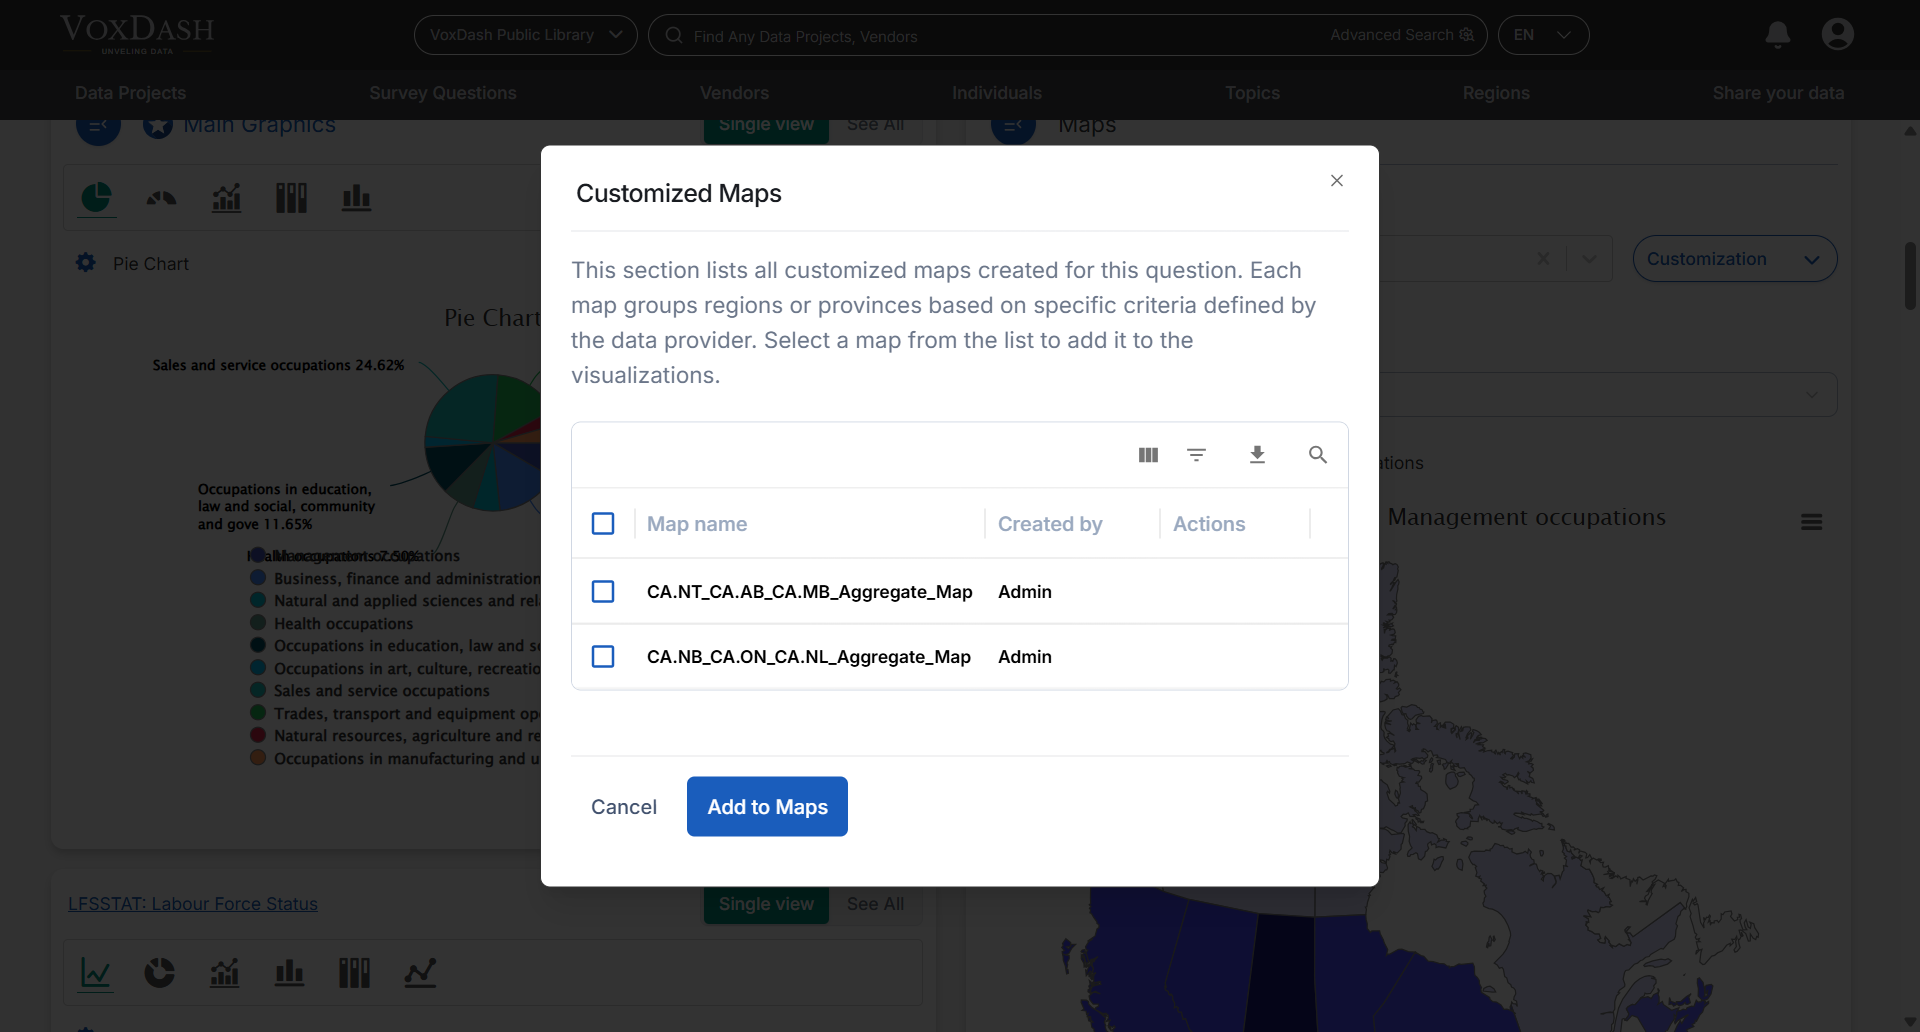
View All Customized Maps
Click on View All Customized Maps to see all the custom maps created by you or the data provider.Each supported map type (from the Select Map dropdown) may have its own set of customized maps.
- Customized maps will be listed under the base maps section.
- Only customized maps related to the currently selected base map will be displayed.
Editing Customized Maps
When you click the Edit button on a customized map:- You can rename the map.
- Add more states to an existing aggregated region.
- Create additional aggregated regions.
- You can’t add the same state to two aggregate groups.
Select and View Specific Geography
When a data project includes nested maps (e.g., Country → State), VoxDash automatically displays the highest-level (most expansive) map first. Even if a user has not uploaded a national-level map, VoxDash will promote the largest available map as the top-level view. Users can then explore subregions by clicking directly on a region within the map. If detailed data is available, VoxDash will automatically drill down into the more granular map. Learn more about map drilldown here.Conclusion
Map visualization in VoxDash transforms raw survey responses into actionable geographic insights. By combining interactive maps, filtering options, and customizable regions, you can:- Discover how responses vary across locations,
- Identify dominant trends within regions, and
- Build custom groupings that match your organization’s structure or research focus.