Question Page Views
This detailed log tracks every view of a survey question page, capturing all contextual metadata around the event. Information included:- Question title
- Survey name
- Associated dataset
- Viewer name/email (if available)
- Indicator showing whether filters were applied
- View type (e.g., direct view, navigation, deep link)
- Understand how users navigate surveys
- Analyze which questions attract the most attention
- Detect usage patterns such as filtered vs. unfiltered exploration
- Identify potential usability issues in long surveys
- UX research on survey interaction
- Evaluating user interest in specific question types
- Supporting audit and compliance logs

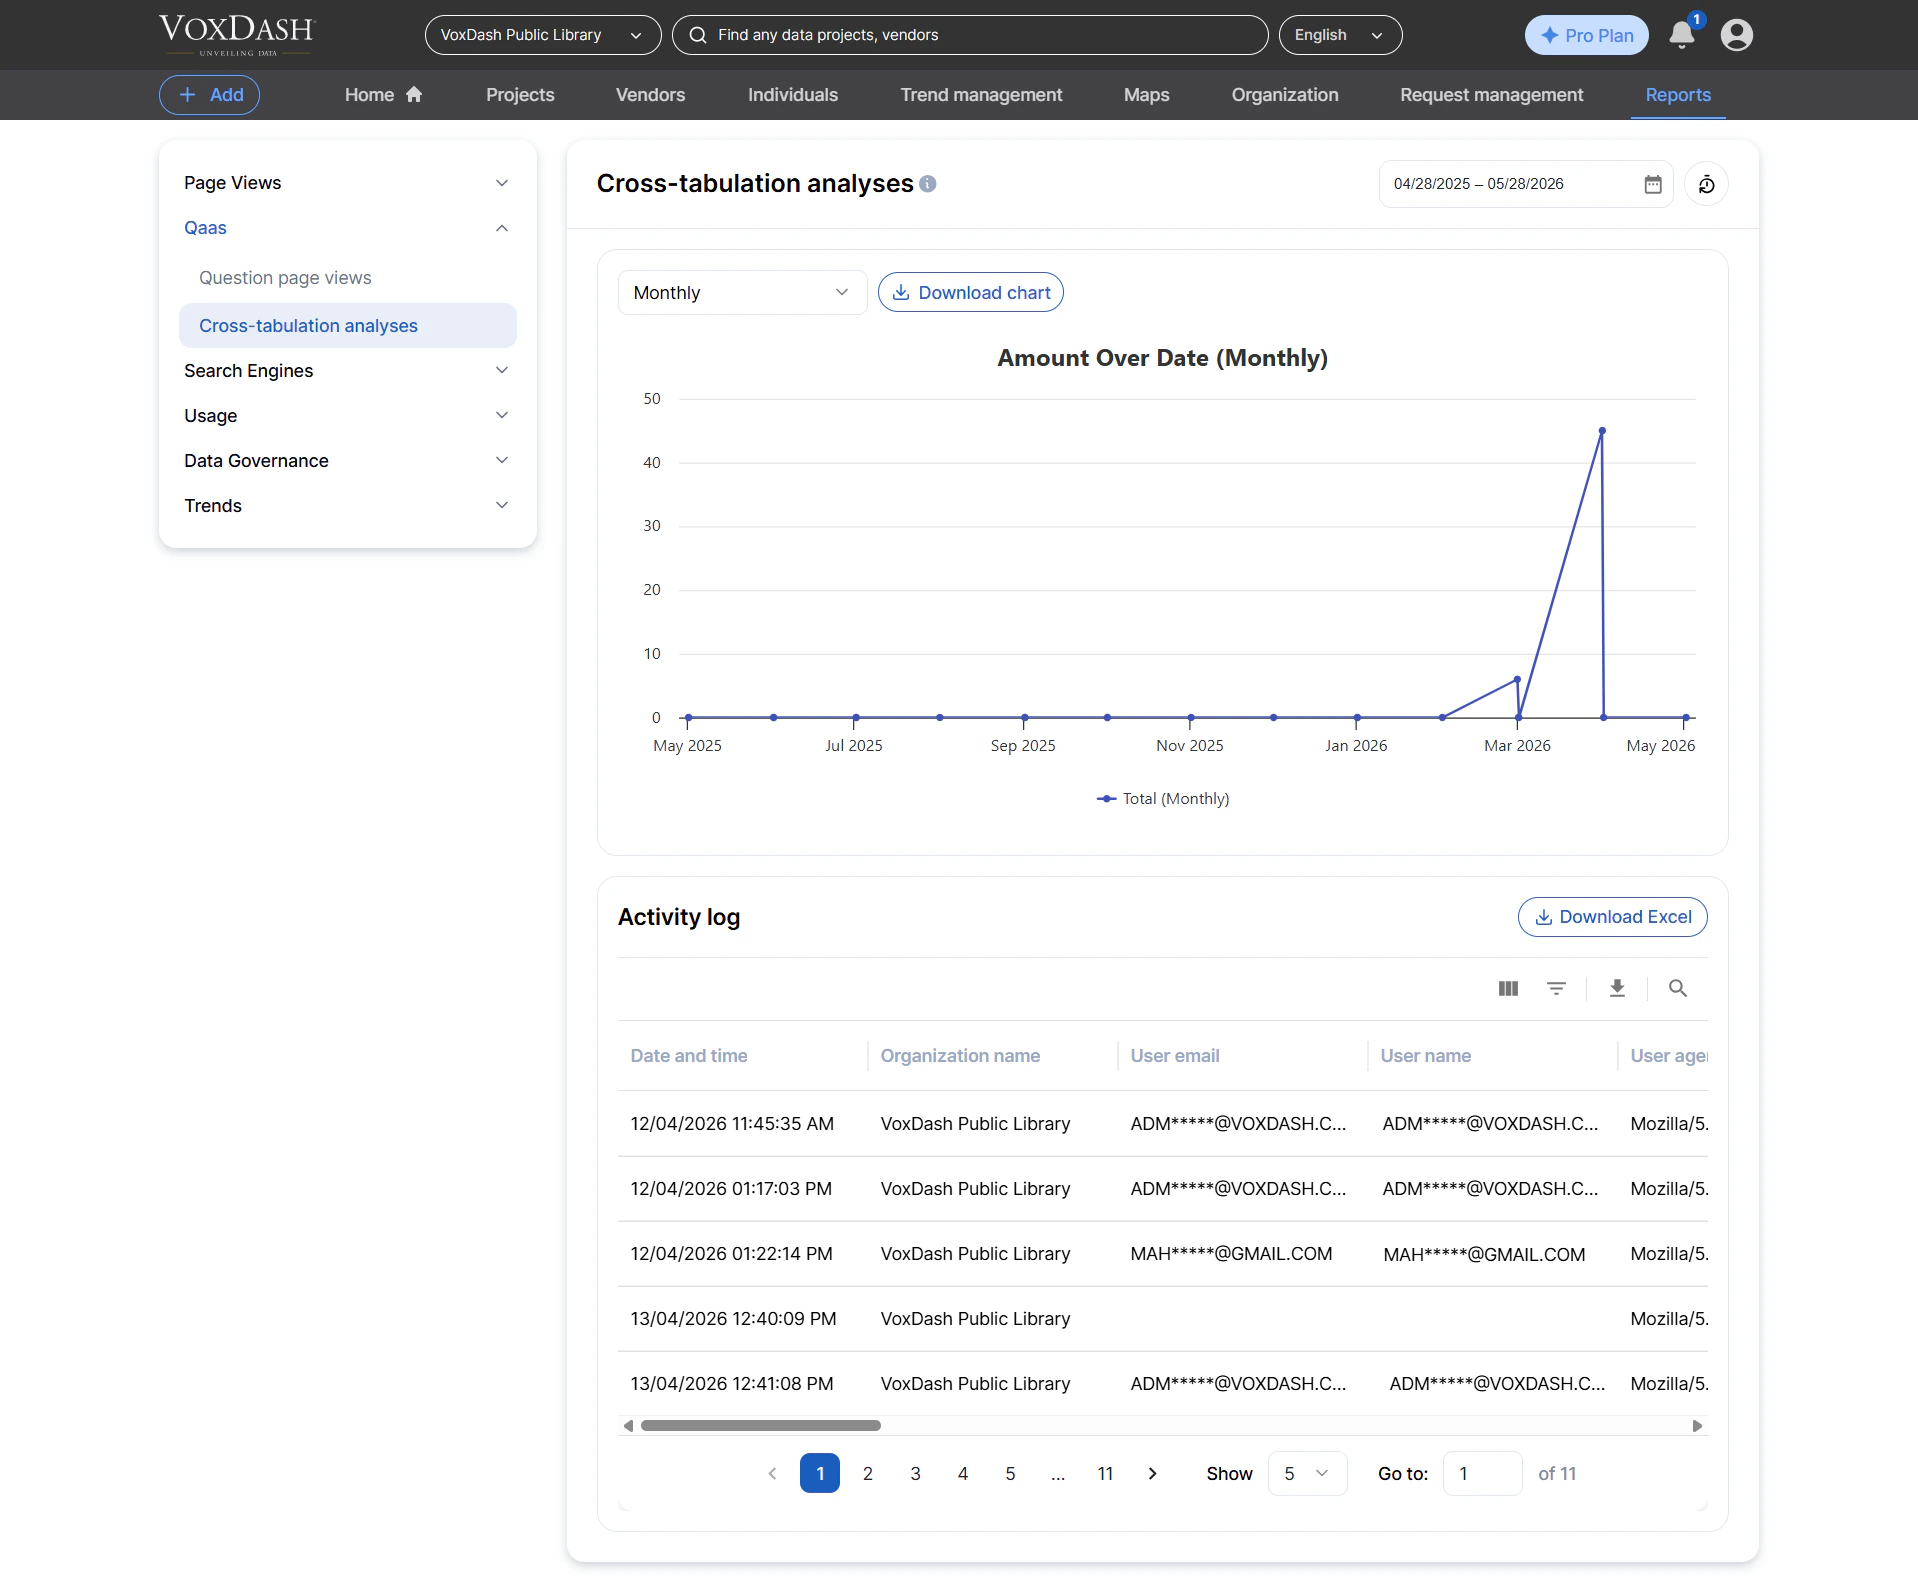
Cross‑Tabulation Analyses
This is a detailed operational log of all cross‑tabulation analyses performed by users.Each entry gives insight into how users compare two different survey questions. Information included:
- Main (primary) question
- Secondary/comparison question
- Survey and dataset names
- Organization or workspace
- User details (name/email)
- Filter status (whether filters were applied)
- Analysis type (e.g., standard cross‑tab, segmented view, advanced filters)
- Understand which comparisons users find most valuable
- Track how decision‑makers analyze survey results
- Identify trends in analytical behavior across teams
- Support audit trails for regulated environments
- Enhancing survey design based on analysis behavior
- Usage‑based billing or enterprise analytics reporting
- Detecting heavy usage for performance scaling